Nigerian vs Osage Householder Income Ages 45 - 64 years
COMPARE
Nigerian
Osage
Householder Income Ages 45 - 64 years
Householder Income Ages 45 - 64 years Comparison
Nigerians
Osage
$95,492
HOUSEHOLDER INCOME AGES 45 - 64 YEARS
8.2/ 100
METRIC RATING
215th/ 347
METRIC RANK
$88,390
HOUSEHOLDER INCOME AGES 45 - 64 YEARS
0.3/ 100
METRIC RATING
264th/ 347
METRIC RANK
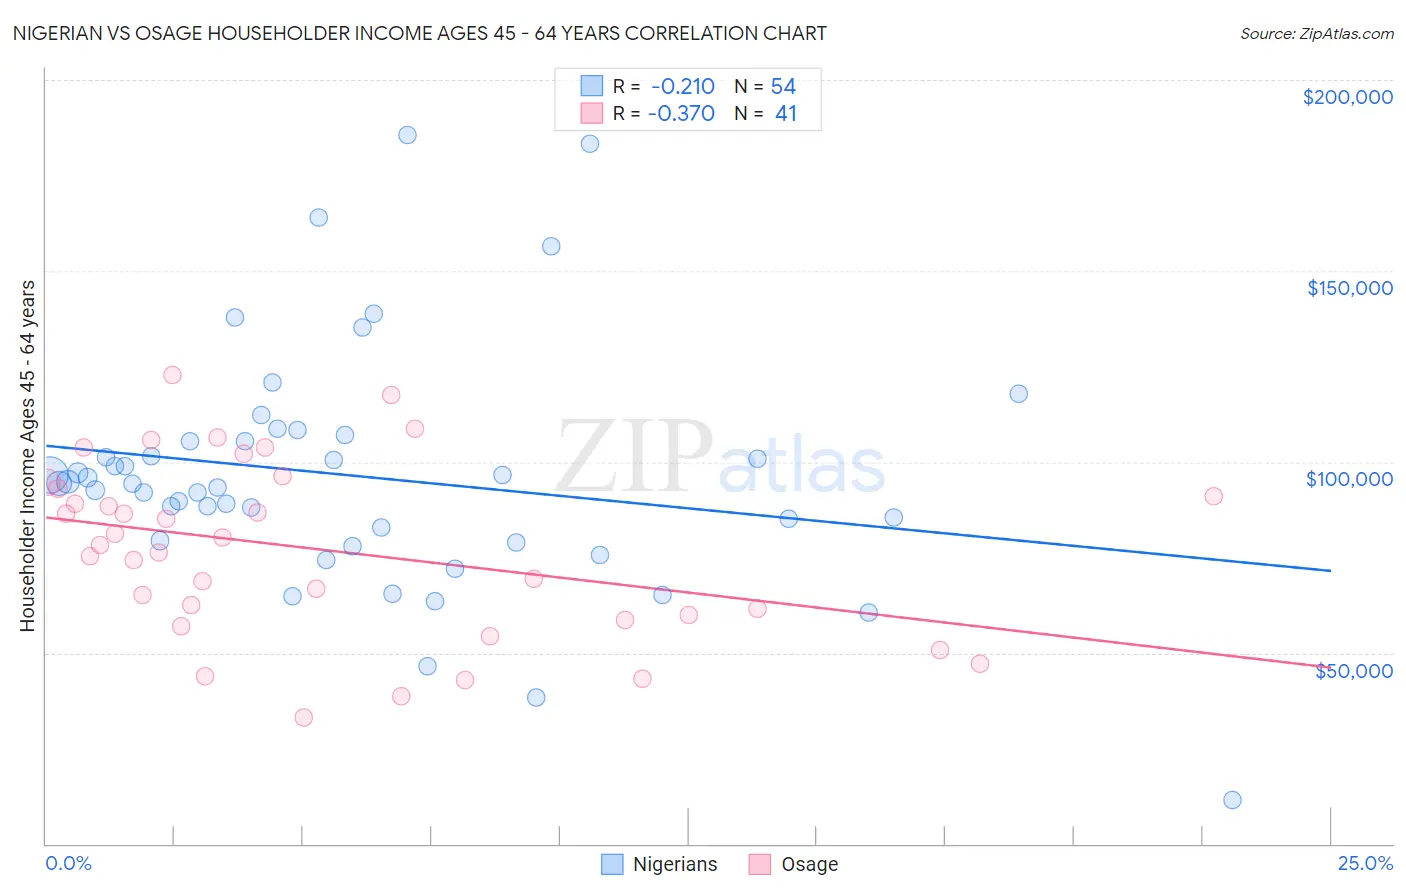
Nigerian vs Osage Householder Income Ages 45 - 64 years Correlation Chart
The statistical analysis conducted on geographies consisting of 332,111,540 people shows a weak negative correlation between the proportion of Nigerians and household income with householder between the ages 45 and 64 in the United States with a correlation coefficient (R) of -0.210 and weighted average of $95,492. Similarly, the statistical analysis conducted on geographies consisting of 91,774,888 people shows a mild negative correlation between the proportion of Osage and household income with householder between the ages 45 and 64 in the United States with a correlation coefficient (R) of -0.370 and weighted average of $88,390, a difference of 8.0%.
Householder Income Ages 45 - 64 years Correlation Summary
| Measurement | Nigerian | Osage |
| Minimum | $11,458 | $33,125 |
| Maximum | $185,761 | $122,824 |
| Range | $174,303 | $89,699 |
| Mean | $96,275 | $76,991 |
| Median | $94,283 | $78,120 |
| Interquartile 25% (IQ1) | $79,390 | $59,314 |
| Interquartile 75% (IQ3) | $105,427 | $93,781 |
| Interquartile Range (IQR) | $26,037 | $34,467 |
| Standard Deviation (Sample) | $31,417 | $22,918 |
| Standard Deviation (Population) | $31,125 | $22,637 |
Similar Demographics by Householder Income Ages 45 - 64 years
Demographics Similar to Nigerians by Householder Income Ages 45 - 64 years
In terms of householder income ages 45 - 64 years, the demographic groups most similar to Nigerians are Immigrants from Venezuela ($95,342, a difference of 0.16%), Immigrants from Ghana ($94,982, a difference of 0.54%), Panamanian ($96,066, a difference of 0.60%), Delaware ($94,914, a difference of 0.61%), and Immigrants from Uruguay ($96,086, a difference of 0.62%).
| Demographics | Rating | Rank | Householder Income Ages 45 - 64 years |
| Scotch-Irish | 16.4 /100 | #208 | Poor $97,073 |
| Japanese | 14.8 /100 | #209 | Poor $96,834 |
| Tsimshian | 14.5 /100 | #210 | Poor $96,783 |
| Immigrants | Cambodia | 13.0 /100 | #211 | Poor $96,537 |
| Venezuelans | 12.6 /100 | #212 | Poor $96,460 |
| Immigrants | Uruguay | 10.7 /100 | #213 | Poor $96,086 |
| Panamanians | 10.6 /100 | #214 | Poor $96,066 |
| Nigerians | 8.2 /100 | #215 | Tragic $95,492 |
| Immigrants | Venezuela | 7.6 /100 | #216 | Tragic $95,342 |
| Immigrants | Ghana | 6.4 /100 | #217 | Tragic $94,982 |
| Delaware | 6.2 /100 | #218 | Tragic $94,914 |
| Immigrants | Armenia | 6.1 /100 | #219 | Tragic $94,863 |
| Salvadorans | 6.0 /100 | #220 | Tragic $94,842 |
| Immigrants | Nigeria | 5.9 /100 | #221 | Tragic $94,804 |
| Malaysians | 5.2 /100 | #222 | Tragic $94,517 |
Demographics Similar to Osage by Householder Income Ages 45 - 64 years
In terms of householder income ages 45 - 64 years, the demographic groups most similar to Osage are Immigrants from Senegal ($88,421, a difference of 0.040%), Jamaican ($88,327, a difference of 0.070%), Somali ($88,600, a difference of 0.24%), Immigrants from West Indies ($88,164, a difference of 0.26%), and Hmong ($88,115, a difference of 0.31%).
| Demographics | Rating | Rank | Householder Income Ages 45 - 64 years |
| German Russians | 0.4 /100 | #257 | Tragic $89,398 |
| Immigrants | Barbados | 0.4 /100 | #258 | Tragic $89,394 |
| Immigrants | Nicaragua | 0.4 /100 | #259 | Tragic $89,108 |
| Liberians | 0.3 /100 | #260 | Tragic $88,929 |
| Belizeans | 0.3 /100 | #261 | Tragic $88,684 |
| Somalis | 0.3 /100 | #262 | Tragic $88,600 |
| Immigrants | Senegal | 0.3 /100 | #263 | Tragic $88,421 |
| Osage | 0.3 /100 | #264 | Tragic $88,390 |
| Jamaicans | 0.2 /100 | #265 | Tragic $88,327 |
| Immigrants | West Indies | 0.2 /100 | #266 | Tragic $88,164 |
| Hmong | 0.2 /100 | #267 | Tragic $88,115 |
| Immigrants | Micronesia | 0.2 /100 | #268 | Tragic $87,864 |
| Spanish Americans | 0.2 /100 | #269 | Tragic $87,836 |
| Immigrants | Liberia | 0.2 /100 | #270 | Tragic $87,739 |
| Guatemalans | 0.2 /100 | #271 | Tragic $87,705 |