Immigrants from Ireland vs Osage Householder Income Ages 45 - 64 years
COMPARE
Immigrants from Ireland
Osage
Householder Income Ages 45 - 64 years
Householder Income Ages 45 - 64 years Comparison
Immigrants from Ireland
Osage
$122,757
HOUSEHOLDER INCOME AGES 45 - 64 YEARS
100.0/ 100
METRIC RATING
13th/ 347
METRIC RANK
$88,390
HOUSEHOLDER INCOME AGES 45 - 64 YEARS
0.3/ 100
METRIC RATING
264th/ 347
METRIC RANK
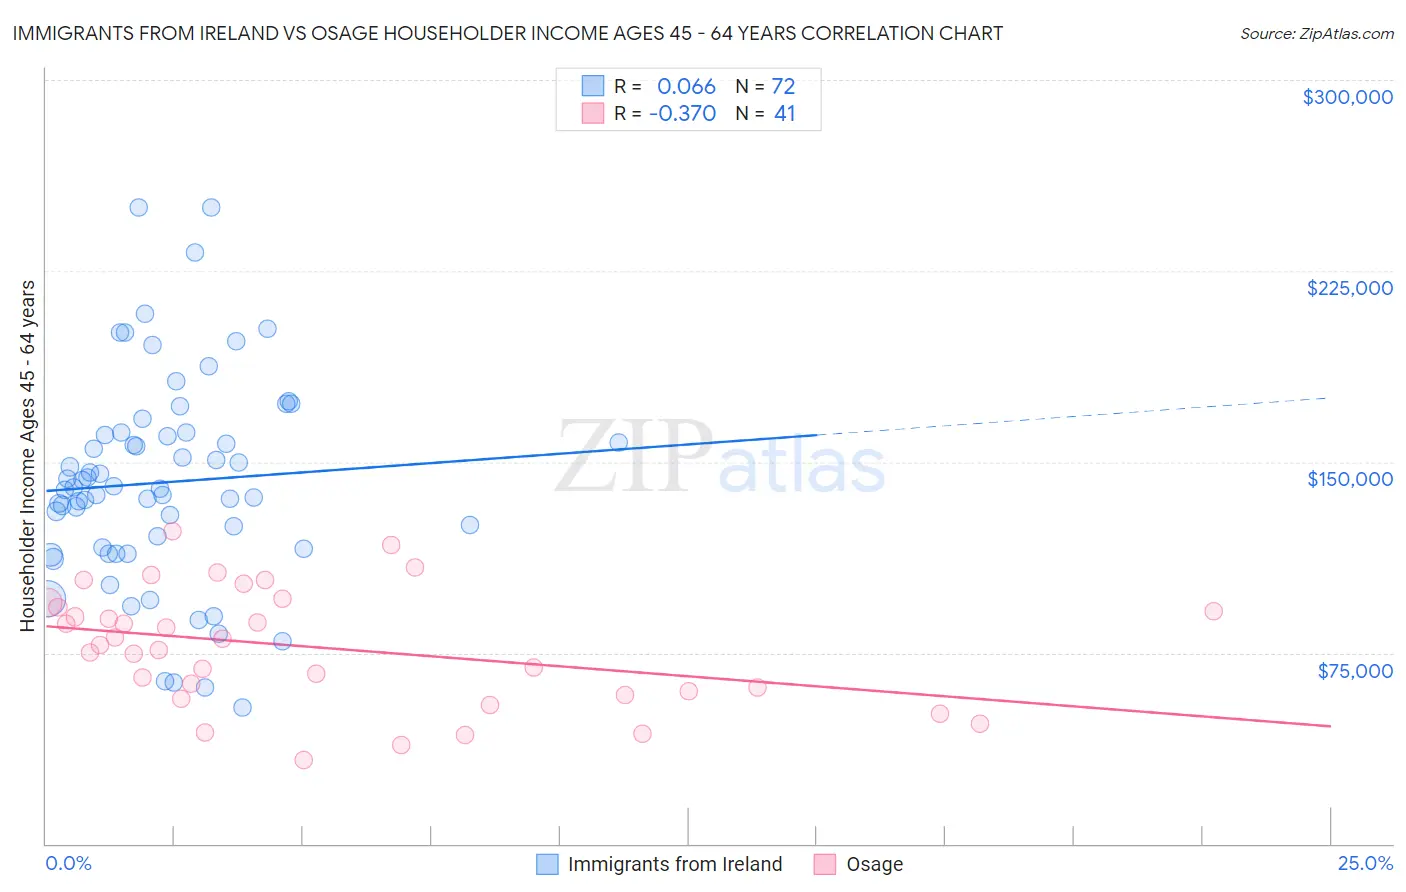
Immigrants from Ireland vs Osage Householder Income Ages 45 - 64 years Correlation Chart
The statistical analysis conducted on geographies consisting of 240,617,521 people shows a slight positive correlation between the proportion of Immigrants from Ireland and household income with householder between the ages 45 and 64 in the United States with a correlation coefficient (R) of 0.066 and weighted average of $122,757. Similarly, the statistical analysis conducted on geographies consisting of 91,774,888 people shows a mild negative correlation between the proportion of Osage and household income with householder between the ages 45 and 64 in the United States with a correlation coefficient (R) of -0.370 and weighted average of $88,390, a difference of 38.9%.
Householder Income Ages 45 - 64 years Correlation Summary
| Measurement | Immigrants from Ireland | Osage |
| Minimum | $53,750 | $33,125 |
| Maximum | $250,001 | $122,824 |
| Range | $196,251 | $89,699 |
| Mean | $141,948 | $76,991 |
| Median | $139,768 | $78,120 |
| Interquartile 25% (IQ1) | $116,086 | $59,314 |
| Interquartile 75% (IQ3) | $161,016 | $93,781 |
| Interquartile Range (IQR) | $44,930 | $34,467 |
| Standard Deviation (Sample) | $40,881 | $22,918 |
| Standard Deviation (Population) | $40,596 | $22,637 |
Similar Demographics by Householder Income Ages 45 - 64 years
Demographics Similar to Immigrants from Ireland by Householder Income Ages 45 - 64 years
In terms of householder income ages 45 - 64 years, the demographic groups most similar to Immigrants from Ireland are Immigrants from Israel ($122,893, a difference of 0.11%), Indian (Asian) ($122,343, a difference of 0.34%), Immigrants from Eastern Asia ($122,222, a difference of 0.44%), Immigrants from China ($122,178, a difference of 0.47%), and Cypriot ($123,396, a difference of 0.52%).
| Demographics | Rating | Rank | Householder Income Ages 45 - 64 years |
| Iranians | 100.0 /100 | #6 | Exceptional $129,350 |
| Immigrants | Hong Kong | 100.0 /100 | #7 | Exceptional $127,500 |
| Immigrants | Iran | 100.0 /100 | #8 | Exceptional $126,940 |
| Okinawans | 100.0 /100 | #9 | Exceptional $124,796 |
| Immigrants | South Central Asia | 100.0 /100 | #10 | Exceptional $124,188 |
| Cypriots | 100.0 /100 | #11 | Exceptional $123,396 |
| Immigrants | Israel | 100.0 /100 | #12 | Exceptional $122,893 |
| Immigrants | Ireland | 100.0 /100 | #13 | Exceptional $122,757 |
| Indians (Asian) | 100.0 /100 | #14 | Exceptional $122,343 |
| Immigrants | Eastern Asia | 100.0 /100 | #15 | Exceptional $122,222 |
| Immigrants | China | 100.0 /100 | #16 | Exceptional $122,178 |
| Burmese | 100.0 /100 | #17 | Exceptional $121,444 |
| Immigrants | Korea | 100.0 /100 | #18 | Exceptional $121,243 |
| Eastern Europeans | 100.0 /100 | #19 | Exceptional $120,684 |
| Immigrants | Australia | 100.0 /100 | #20 | Exceptional $119,308 |
Demographics Similar to Osage by Householder Income Ages 45 - 64 years
In terms of householder income ages 45 - 64 years, the demographic groups most similar to Osage are Immigrants from Senegal ($88,421, a difference of 0.040%), Jamaican ($88,327, a difference of 0.070%), Somali ($88,600, a difference of 0.24%), Immigrants from West Indies ($88,164, a difference of 0.26%), and Hmong ($88,115, a difference of 0.31%).
| Demographics | Rating | Rank | Householder Income Ages 45 - 64 years |
| German Russians | 0.4 /100 | #257 | Tragic $89,398 |
| Immigrants | Barbados | 0.4 /100 | #258 | Tragic $89,394 |
| Immigrants | Nicaragua | 0.4 /100 | #259 | Tragic $89,108 |
| Liberians | 0.3 /100 | #260 | Tragic $88,929 |
| Belizeans | 0.3 /100 | #261 | Tragic $88,684 |
| Somalis | 0.3 /100 | #262 | Tragic $88,600 |
| Immigrants | Senegal | 0.3 /100 | #263 | Tragic $88,421 |
| Osage | 0.3 /100 | #264 | Tragic $88,390 |
| Jamaicans | 0.2 /100 | #265 | Tragic $88,327 |
| Immigrants | West Indies | 0.2 /100 | #266 | Tragic $88,164 |
| Hmong | 0.2 /100 | #267 | Tragic $88,115 |
| Immigrants | Micronesia | 0.2 /100 | #268 | Tragic $87,864 |
| Spanish Americans | 0.2 /100 | #269 | Tragic $87,836 |
| Immigrants | Liberia | 0.2 /100 | #270 | Tragic $87,739 |
| Guatemalans | 0.2 /100 | #271 | Tragic $87,705 |