Immigrants from Nicaragua vs Jamaican Hearing Disability
COMPARE
Immigrants from Nicaragua
Jamaican
Hearing Disability
Hearing Disability Comparison
Immigrants from Nicaragua
Jamaicans
2.7%
HEARING DISABILITY
99.0/ 100
METRIC RATING
56th/ 347
METRIC RANK
2.7%
HEARING DISABILITY
99.0/ 100
METRIC RATING
52nd/ 347
METRIC RANK
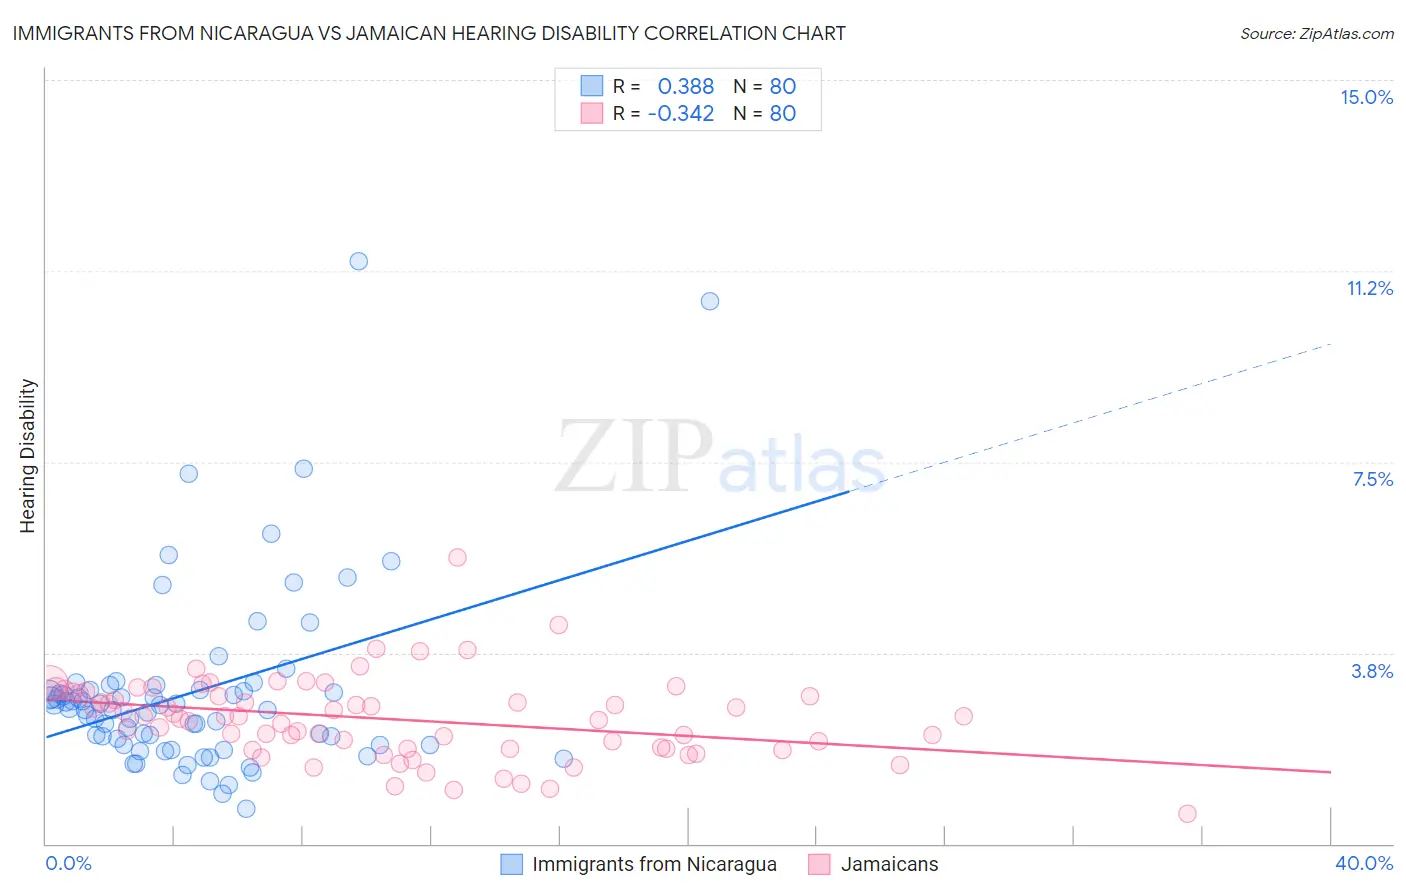
Immigrants from Nicaragua vs Jamaican Hearing Disability Correlation Chart
The statistical analysis conducted on geographies consisting of 236,296,931 people shows a mild positive correlation between the proportion of Immigrants from Nicaragua and percentage of population with hearing disability in the United States with a correlation coefficient (R) of 0.388 and weighted average of 2.7%. Similarly, the statistical analysis conducted on geographies consisting of 367,784,846 people shows a mild negative correlation between the proportion of Jamaicans and percentage of population with hearing disability in the United States with a correlation coefficient (R) of -0.342 and weighted average of 2.7%, a difference of 0.19%.
Hearing Disability Correlation Summary
| Measurement | Immigrants from Nicaragua | Jamaican |
| Minimum | 0.69% | 0.58% |
| Maximum | 11.4% | 5.6% |
| Range | 10.7% | 5.0% |
| Mean | 3.0% | 2.5% |
| Median | 2.6% | 2.5% |
| Interquartile 25% (IQ1) | 1.9% | 1.9% |
| Interquartile 75% (IQ3) | 3.0% | 3.0% |
| Interquartile Range (IQR) | 1.1% | 1.1% |
| Standard Deviation (Sample) | 1.8% | 0.80% |
| Standard Deviation (Population) | 1.8% | 0.80% |
Demographics Similar to Immigrants from Nicaragua and Jamaicans by Hearing Disability
In terms of hearing disability, the demographic groups most similar to Immigrants from Nicaragua are Immigrants from Ethiopia (2.7%, a difference of 0.020%), South American (2.7%, a difference of 0.040%), Ethiopian (2.7%, a difference of 0.090%), Immigrants from Eastern Asia (2.7%, a difference of 0.12%), and Immigrants from Hong Kong (2.7%, a difference of 0.54%). Similarly, the demographic groups most similar to Jamaicans are Immigrants from Eastern Asia (2.7%, a difference of 0.070%), Ethiopian (2.7%, a difference of 0.10%), Immigrants from Ethiopia (2.7%, a difference of 0.16%), South American (2.7%, a difference of 0.23%), and Immigrants from Hong Kong (2.7%, a difference of 0.36%).
| Demographics | Rating | Rank | Hearing Disability |
| Nigerians | 99.4 /100 | #44 | Exceptional 2.6% |
| Venezuelans | 99.4 /100 | #45 | Exceptional 2.6% |
| Immigrants | Dominica | 99.3 /100 | #46 | Exceptional 2.6% |
| Immigrants | Israel | 99.3 /100 | #47 | Exceptional 2.6% |
| Immigrants | Singapore | 99.3 /100 | #48 | Exceptional 2.6% |
| Immigrants | South America | 99.2 /100 | #49 | Exceptional 2.7% |
| Paraguayans | 99.2 /100 | #50 | Exceptional 2.7% |
| Immigrants | Hong Kong | 99.2 /100 | #51 | Exceptional 2.7% |
| Jamaicans | 99.0 /100 | #52 | Exceptional 2.7% |
| Immigrants | Eastern Asia | 99.0 /100 | #53 | Exceptional 2.7% |
| Ethiopians | 99.0 /100 | #54 | Exceptional 2.7% |
| Immigrants | Ethiopia | 99.0 /100 | #55 | Exceptional 2.7% |
| Immigrants | Nicaragua | 99.0 /100 | #56 | Exceptional 2.7% |
| South Americans | 99.0 /100 | #57 | Exceptional 2.7% |
| Immigrants | Peru | 98.6 /100 | #58 | Exceptional 2.7% |
| Immigrants | Eritrea | 98.5 /100 | #59 | Exceptional 2.7% |
| Immigrants | Egypt | 98.5 /100 | #60 | Exceptional 2.7% |
| Immigrants | Uzbekistan | 98.4 /100 | #61 | Exceptional 2.7% |
| Immigrants | Colombia | 98.4 /100 | #62 | Exceptional 2.7% |
| Indians (Asian) | 98.4 /100 | #63 | Exceptional 2.7% |
| Immigrants | Sri Lanka | 98.4 /100 | #64 | Exceptional 2.7% |