Immigrants from Nicaragua vs Immigrants from Kazakhstan Householder Income Over 65 years
COMPARE
Immigrants from Nicaragua
Immigrants from Kazakhstan
Householder Income Over 65 years
Householder Income Over 65 years Comparison
Immigrants from Nicaragua
Immigrants from Kazakhstan
$52,085
HOUSEHOLDER INCOME OVER 65 YEARS
0.0/ 100
METRIC RATING
313th/ 347
METRIC RANK
$62,292
HOUSEHOLDER INCOME OVER 65 YEARS
80.0/ 100
METRIC RATING
138th/ 347
METRIC RANK
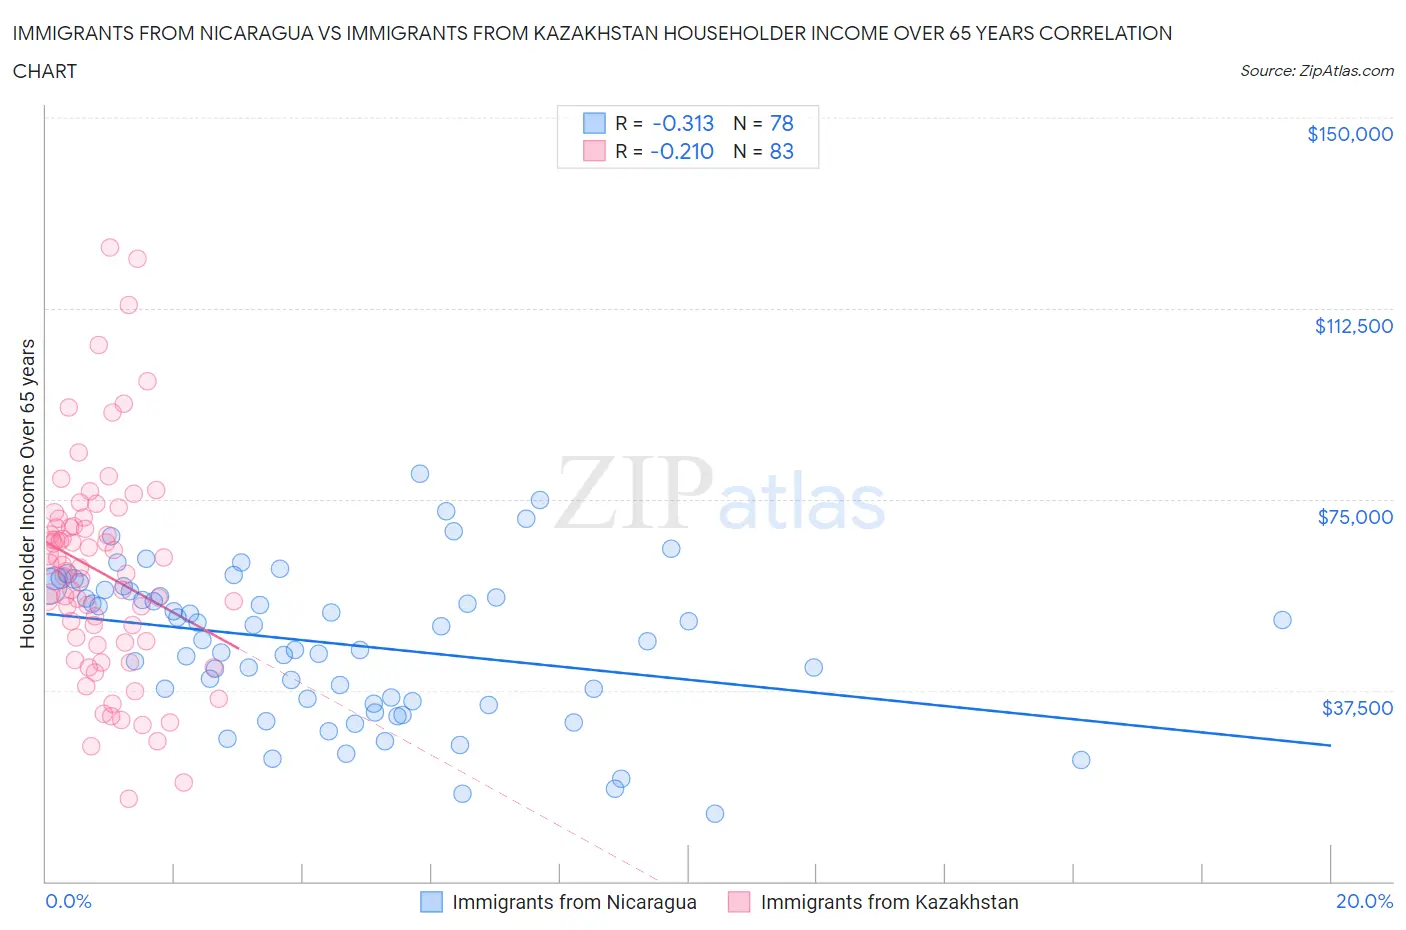
Immigrants from Nicaragua vs Immigrants from Kazakhstan Householder Income Over 65 years Correlation Chart
The statistical analysis conducted on geographies consisting of 236,036,400 people shows a mild negative correlation between the proportion of Immigrants from Nicaragua and household income with householder over the age of 65 in the United States with a correlation coefficient (R) of -0.313 and weighted average of $52,085. Similarly, the statistical analysis conducted on geographies consisting of 124,347,353 people shows a weak negative correlation between the proportion of Immigrants from Kazakhstan and household income with householder over the age of 65 in the United States with a correlation coefficient (R) of -0.210 and weighted average of $62,292, a difference of 19.6%.
Householder Income Over 65 years Correlation Summary
| Measurement | Immigrants from Nicaragua | Immigrants from Kazakhstan |
| Minimum | $13,371 | $16,126 |
| Maximum | $80,000 | $124,402 |
| Range | $66,629 | $108,276 |
| Mean | $46,721 | $60,647 |
| Median | $48,735 | $60,915 |
| Interquartile 25% (IQ1) | $35,431 | $46,912 |
| Interquartile 75% (IQ3) | $57,245 | $69,745 |
| Interquartile Range (IQR) | $21,814 | $22,833 |
| Standard Deviation (Sample) | $14,647 | $21,151 |
| Standard Deviation (Population) | $14,553 | $21,023 |
Similar Demographics by Householder Income Over 65 years
Demographics Similar to Immigrants from Nicaragua by Householder Income Over 65 years
In terms of householder income over 65 years, the demographic groups most similar to Immigrants from Nicaragua are Native/Alaskan ($52,081, a difference of 0.010%), U.S. Virgin Islander ($52,072, a difference of 0.020%), Immigrants from the Azores ($52,121, a difference of 0.070%), Creek ($51,949, a difference of 0.26%), and Immigrants from St. Vincent and the Grenadines ($51,922, a difference of 0.31%).
| Demographics | Rating | Rank | Householder Income Over 65 years |
| Pennsylvania Germans | 0.0 /100 | #306 | Tragic $52,888 |
| Hispanics or Latinos | 0.0 /100 | #307 | Tragic $52,832 |
| Immigrants | Mexico | 0.0 /100 | #308 | Tragic $52,801 |
| Hondurans | 0.0 /100 | #309 | Tragic $52,634 |
| Sioux | 0.0 /100 | #310 | Tragic $52,509 |
| Seminole | 0.0 /100 | #311 | Tragic $52,373 |
| Immigrants | Azores | 0.0 /100 | #312 | Tragic $52,121 |
| Immigrants | Nicaragua | 0.0 /100 | #313 | Tragic $52,085 |
| Natives/Alaskans | 0.0 /100 | #314 | Tragic $52,081 |
| U.S. Virgin Islanders | 0.0 /100 | #315 | Tragic $52,072 |
| Creek | 0.0 /100 | #316 | Tragic $51,949 |
| Immigrants | St. Vincent and the Grenadines | 0.0 /100 | #317 | Tragic $51,922 |
| Haitians | 0.0 /100 | #318 | Tragic $51,912 |
| Immigrants | Honduras | 0.0 /100 | #319 | Tragic $51,888 |
| Colville | 0.0 /100 | #320 | Tragic $51,739 |
Demographics Similar to Immigrants from Kazakhstan by Householder Income Over 65 years
In terms of householder income over 65 years, the demographic groups most similar to Immigrants from Kazakhstan are Lebanese ($62,287, a difference of 0.010%), Immigrants from Syria ($62,303, a difference of 0.020%), Arab ($62,266, a difference of 0.040%), Alaskan Athabascan ($62,330, a difference of 0.060%), and Immigrants from Chile ($62,354, a difference of 0.10%).
| Demographics | Rating | Rank | Householder Income Over 65 years |
| Immigrants | Western Asia | 85.3 /100 | #131 | Excellent $62,645 |
| Immigrants | Germany | 83.9 /100 | #132 | Excellent $62,544 |
| Immigrants | Northern Africa | 83.6 /100 | #133 | Excellent $62,522 |
| Immigrants | Brazil | 81.2 /100 | #134 | Excellent $62,364 |
| Immigrants | Chile | 81.0 /100 | #135 | Excellent $62,354 |
| Alaskan Athabascans | 80.6 /100 | #136 | Excellent $62,330 |
| Immigrants | Syria | 80.2 /100 | #137 | Excellent $62,303 |
| Immigrants | Kazakhstan | 80.0 /100 | #138 | Excellent $62,292 |
| Lebanese | 79.9 /100 | #139 | Good $62,287 |
| Arabs | 79.6 /100 | #140 | Good $62,266 |
| Canadians | 79.0 /100 | #141 | Good $62,230 |
| South American Indians | 78.7 /100 | #142 | Good $62,215 |
| Immigrants | Belarus | 77.8 /100 | #143 | Good $62,162 |
| Immigrants | Peru | 74.4 /100 | #144 | Good $61,988 |
| Immigrants | Uganda | 74.2 /100 | #145 | Good $61,976 |