Egyptian vs Immigrants from Chile Householder Income Ages 25 - 44 years
COMPARE
Egyptian
Immigrants from Chile
Householder Income Ages 25 - 44 years
Householder Income Ages 25 - 44 years Comparison
Egyptians
Immigrants from Chile
$105,282
HOUSEHOLDER INCOME AGES 25 - 44 YEARS
99.7/ 100
METRIC RATING
60th/ 347
METRIC RANK
$97,159
HOUSEHOLDER INCOME AGES 25 - 44 YEARS
80.8/ 100
METRIC RATING
144th/ 347
METRIC RANK
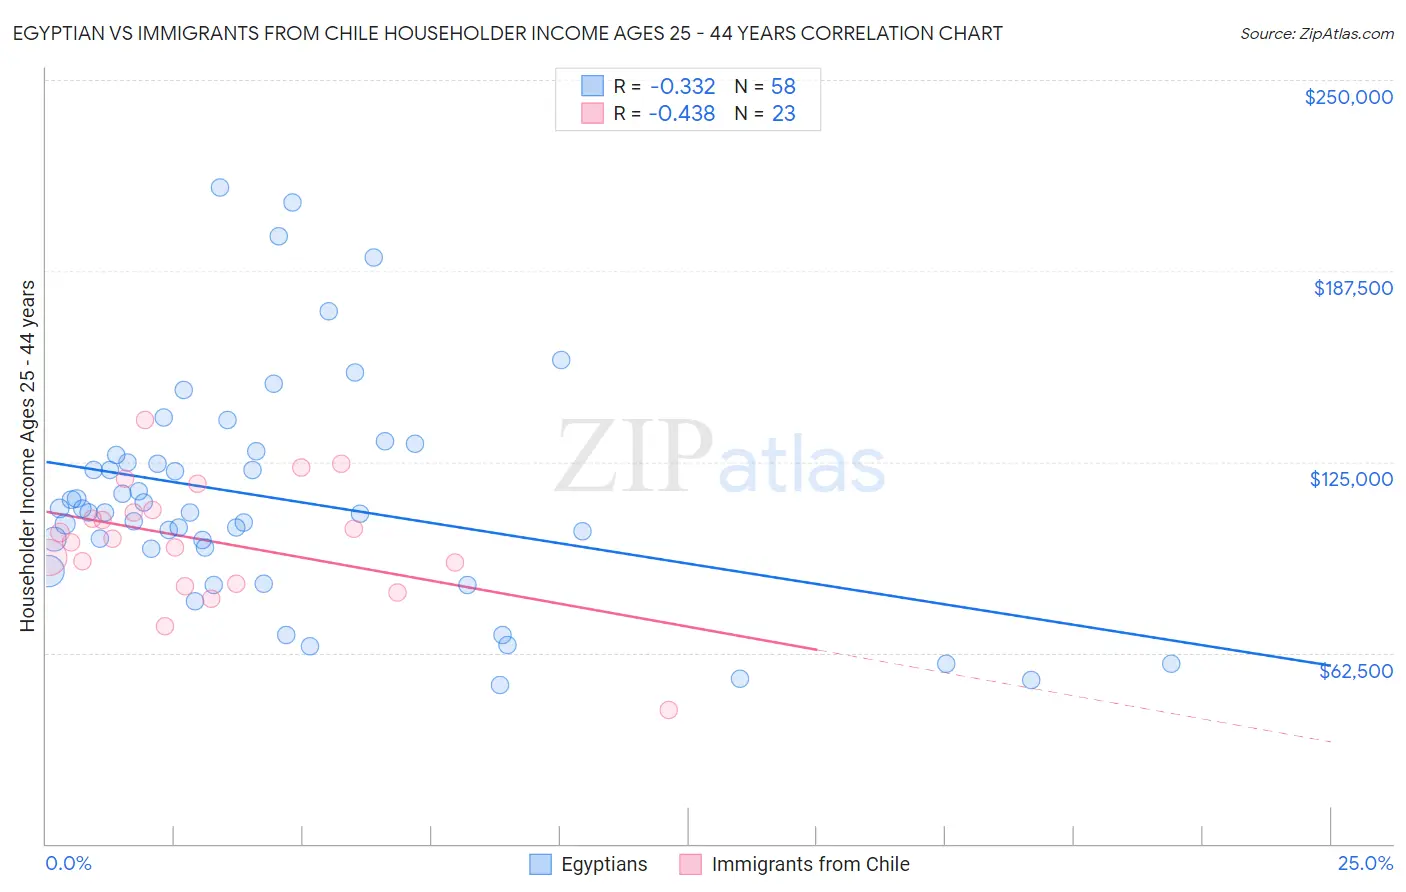
Egyptian vs Immigrants from Chile Householder Income Ages 25 - 44 years Correlation Chart
The statistical analysis conducted on geographies consisting of 276,427,528 people shows a mild negative correlation between the proportion of Egyptians and household income with householder between the ages 25 and 44 in the United States with a correlation coefficient (R) of -0.332 and weighted average of $105,282. Similarly, the statistical analysis conducted on geographies consisting of 218,505,323 people shows a moderate negative correlation between the proportion of Immigrants from Chile and household income with householder between the ages 25 and 44 in the United States with a correlation coefficient (R) of -0.438 and weighted average of $97,159, a difference of 8.4%.
Householder Income Ages 25 - 44 years Correlation Summary
| Measurement | Egyptian | Immigrants from Chile |
| Minimum | $52,083 | $43,889 |
| Maximum | $214,879 | $138,706 |
| Range | $162,796 | $94,817 |
| Mean | $112,843 | $99,118 |
| Median | $108,598 | $99,927 |
| Interquartile 25% (IQ1) | $96,583 | $85,105 |
| Interquartile 75% (IQ3) | $127,216 | $109,064 |
| Interquartile Range (IQR) | $30,633 | $23,959 |
| Standard Deviation (Sample) | $36,905 | $20,106 |
| Standard Deviation (Population) | $36,586 | $19,664 |
Similar Demographics by Householder Income Ages 25 - 44 years
Demographics Similar to Egyptians by Householder Income Ages 25 - 44 years
In terms of householder income ages 25 - 44 years, the demographic groups most similar to Egyptians are Lithuanian ($105,223, a difference of 0.060%), Immigrants from Italy ($105,201, a difference of 0.080%), Immigrants from Scotland ($105,089, a difference of 0.18%), New Zealander ($105,085, a difference of 0.19%), and Immigrants from Netherlands ($105,082, a difference of 0.19%).
| Demographics | Rating | Rank | Householder Income Ages 25 - 44 years |
| Immigrants | Norway | 99.9 /100 | #53 | Exceptional $106,629 |
| Paraguayans | 99.9 /100 | #54 | Exceptional $106,615 |
| Greeks | 99.9 /100 | #55 | Exceptional $106,457 |
| Immigrants | Pakistan | 99.8 /100 | #56 | Exceptional $106,129 |
| Immigrants | Austria | 99.8 /100 | #57 | Exceptional $106,103 |
| Immigrants | South Africa | 99.8 /100 | #58 | Exceptional $105,748 |
| Immigrants | Latvia | 99.8 /100 | #59 | Exceptional $105,522 |
| Egyptians | 99.7 /100 | #60 | Exceptional $105,282 |
| Lithuanians | 99.7 /100 | #61 | Exceptional $105,223 |
| Immigrants | Italy | 99.7 /100 | #62 | Exceptional $105,201 |
| Immigrants | Scotland | 99.7 /100 | #63 | Exceptional $105,089 |
| New Zealanders | 99.7 /100 | #64 | Exceptional $105,085 |
| Immigrants | Netherlands | 99.7 /100 | #65 | Exceptional $105,082 |
| Laotians | 99.7 /100 | #66 | Exceptional $104,993 |
| Immigrants | Romania | 99.6 /100 | #67 | Exceptional $104,713 |
Demographics Similar to Immigrants from Chile by Householder Income Ages 25 - 44 years
In terms of householder income ages 25 - 44 years, the demographic groups most similar to Immigrants from Chile are Immigrants from Jordan ($97,185, a difference of 0.030%), Danish ($97,221, a difference of 0.060%), Luxembourger ($97,237, a difference of 0.080%), Immigrants from Morocco ($97,305, a difference of 0.15%), and Arab ($97,336, a difference of 0.18%).
| Demographics | Rating | Rank | Householder Income Ages 25 - 44 years |
| Lebanese | 82.3 /100 | #137 | Excellent $97,339 |
| Arabs | 82.3 /100 | #138 | Excellent $97,336 |
| Immigrants | Peru | 82.2 /100 | #139 | Excellent $97,329 |
| Immigrants | Morocco | 82.0 /100 | #140 | Excellent $97,305 |
| Luxembourgers | 81.5 /100 | #141 | Excellent $97,237 |
| Danes | 81.3 /100 | #142 | Excellent $97,221 |
| Immigrants | Jordan | 81.0 /100 | #143 | Excellent $97,185 |
| Immigrants | Chile | 80.8 /100 | #144 | Excellent $97,159 |
| Norwegians | 78.2 /100 | #145 | Good $96,866 |
| Ethiopians | 77.8 /100 | #146 | Good $96,824 |
| Immigrants | Syria | 77.4 /100 | #147 | Good $96,789 |
| Irish | 76.9 /100 | #148 | Good $96,730 |
| Basques | 76.6 /100 | #149 | Good $96,709 |
| Ugandans | 76.2 /100 | #150 | Good $96,667 |
| Czechs | 74.8 /100 | #151 | Good $96,525 |