Immigrants from Belize vs Immigrants from Chile Householder Income Ages 25 - 44 years
COMPARE
Immigrants from Belize
Immigrants from Chile
Householder Income Ages 25 - 44 years
Householder Income Ages 25 - 44 years Comparison
Immigrants from Belize
Immigrants from Chile
$83,141
HOUSEHOLDER INCOME AGES 25 - 44 YEARS
0.2/ 100
METRIC RATING
276th/ 347
METRIC RANK
$97,159
HOUSEHOLDER INCOME AGES 25 - 44 YEARS
80.8/ 100
METRIC RATING
144th/ 347
METRIC RANK
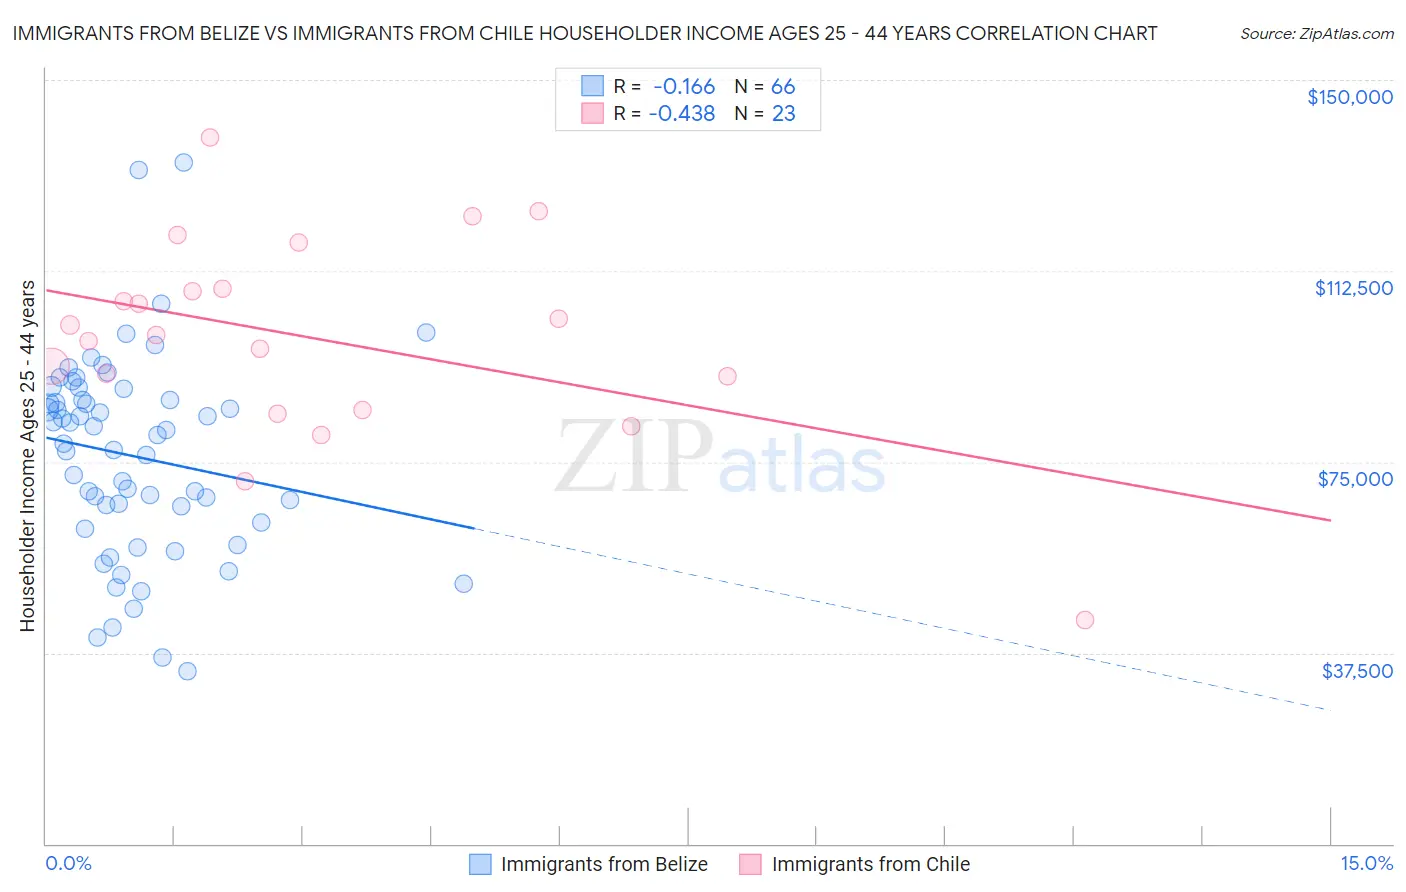
Immigrants from Belize vs Immigrants from Chile Householder Income Ages 25 - 44 years Correlation Chart
The statistical analysis conducted on geographies consisting of 130,243,776 people shows a poor negative correlation between the proportion of Immigrants from Belize and household income with householder between the ages 25 and 44 in the United States with a correlation coefficient (R) of -0.166 and weighted average of $83,141. Similarly, the statistical analysis conducted on geographies consisting of 218,505,323 people shows a moderate negative correlation between the proportion of Immigrants from Chile and household income with householder between the ages 25 and 44 in the United States with a correlation coefficient (R) of -0.438 and weighted average of $97,159, a difference of 16.9%.
Householder Income Ages 25 - 44 years Correlation Summary
| Measurement | Immigrants from Belize | Immigrants from Chile |
| Minimum | $33,992 | $43,889 |
| Maximum | $133,906 | $138,706 |
| Range | $99,914 | $94,817 |
| Mean | $76,120 | $99,118 |
| Median | $79,346 | $99,927 |
| Interquartile 25% (IQ1) | $63,154 | $85,105 |
| Interquartile 75% (IQ3) | $87,209 | $109,064 |
| Interquartile Range (IQR) | $24,055 | $23,959 |
| Standard Deviation (Sample) | $19,762 | $20,106 |
| Standard Deviation (Population) | $19,612 | $19,664 |
Similar Demographics by Householder Income Ages 25 - 44 years
Demographics Similar to Immigrants from Belize by Householder Income Ages 25 - 44 years
In terms of householder income ages 25 - 44 years, the demographic groups most similar to Immigrants from Belize are Immigrants from Jamaica ($83,298, a difference of 0.19%), Paiute ($82,984, a difference of 0.19%), Senegalese ($82,852, a difference of 0.35%), Pima ($82,821, a difference of 0.39%), and Marshallese ($83,575, a difference of 0.52%).
| Demographics | Rating | Rank | Householder Income Ages 25 - 44 years |
| Spanish American Indians | 0.3 /100 | #269 | Tragic $84,085 |
| Jamaicans | 0.3 /100 | #270 | Tragic $83,933 |
| Somalis | 0.2 /100 | #271 | Tragic $83,752 |
| Spanish Americans | 0.2 /100 | #272 | Tragic $83,722 |
| Iroquois | 0.2 /100 | #273 | Tragic $83,682 |
| Marshallese | 0.2 /100 | #274 | Tragic $83,575 |
| Immigrants | Jamaica | 0.2 /100 | #275 | Tragic $83,298 |
| Immigrants | Belize | 0.2 /100 | #276 | Tragic $83,141 |
| Paiute | 0.2 /100 | #277 | Tragic $82,984 |
| Senegalese | 0.2 /100 | #278 | Tragic $82,852 |
| Pima | 0.1 /100 | #279 | Tragic $82,821 |
| Colville | 0.1 /100 | #280 | Tragic $82,604 |
| Cajuns | 0.1 /100 | #281 | Tragic $82,393 |
| Central American Indians | 0.1 /100 | #282 | Tragic $82,355 |
| Guatemalans | 0.1 /100 | #283 | Tragic $82,331 |
Demographics Similar to Immigrants from Chile by Householder Income Ages 25 - 44 years
In terms of householder income ages 25 - 44 years, the demographic groups most similar to Immigrants from Chile are Immigrants from Jordan ($97,185, a difference of 0.030%), Danish ($97,221, a difference of 0.060%), Luxembourger ($97,237, a difference of 0.080%), Immigrants from Morocco ($97,305, a difference of 0.15%), and Arab ($97,336, a difference of 0.18%).
| Demographics | Rating | Rank | Householder Income Ages 25 - 44 years |
| Lebanese | 82.3 /100 | #137 | Excellent $97,339 |
| Arabs | 82.3 /100 | #138 | Excellent $97,336 |
| Immigrants | Peru | 82.2 /100 | #139 | Excellent $97,329 |
| Immigrants | Morocco | 82.0 /100 | #140 | Excellent $97,305 |
| Luxembourgers | 81.5 /100 | #141 | Excellent $97,237 |
| Danes | 81.3 /100 | #142 | Excellent $97,221 |
| Immigrants | Jordan | 81.0 /100 | #143 | Excellent $97,185 |
| Immigrants | Chile | 80.8 /100 | #144 | Excellent $97,159 |
| Norwegians | 78.2 /100 | #145 | Good $96,866 |
| Ethiopians | 77.8 /100 | #146 | Good $96,824 |
| Immigrants | Syria | 77.4 /100 | #147 | Good $96,789 |
| Irish | 76.9 /100 | #148 | Good $96,730 |
| Basques | 76.6 /100 | #149 | Good $96,709 |
| Ugandans | 76.2 /100 | #150 | Good $96,667 |
| Czechs | 74.8 /100 | #151 | Good $96,525 |