Immigrants from Middle Africa vs Delaware Householder Income Ages 25 - 44 years

COMPARE

Immigrants from Middle Africa
Race
Ancestry
AfghanAfricanAlaska NativeAlaskan AthabascanAlbanianAleutAlsatianAmericanApacheArabArapahoArgentineanArmenianAssyrian/Chaldean/SyriacAustralianAustrianBahamianBangladeshiBarbadianBasqueBelgianBelizeanBermudanBhutaneseBlackfeetBolivianBrazilianBritishBritish West IndianBulgarianBurmeseCajunCambodianCanadianCape VerdeanCarpatho RusynCelticCentral AmericanCentral American IndianCherokeeCheyenneChickasawChileanChineseChippewaChoctawColombianColvilleComancheCosta RicanCreeCreekCroatianCrowCubanCypriotCzechCzechoslovakianDanishDominicanDutchDutch West IndianEastern EuropeanEcuadorianEgyptianEnglishEstonianEthiopianEuropeanFijianFilipinoFinnishFrenchFrench American IndianFrench CanadianGermanGerman RussianGhanaianGreekGuamanian/ChamorroGuatemalanGuyaneseHaitianHmongHonduranHopiHoumaHungarianIcelanderIndian (Asian)IndonesianInupiatIranianIraqiIrishIroquoisIsraeliItalianJamaicanJapaneseJordanianKenyanKiowaKoreanLaotianLatvianLebaneseLiberianLithuanianLumbeeLuxembourgerMacedonianMalaysianMalteseMarshalleseMenomineeMexicanMexican American IndianMongolianMoroccanNative HawaiianNavajoNepaleseNew ZealanderNicaraguanNigerianNorthern EuropeanNorwegianOkinawanOsageOttawaPaiutePakistaniPalestinianPanamanianParaguayanPennsylvania GermanPeruvianPimaPolishPortuguesePotawatomiPuebloPuerto RicanPuget Sound SalishRomanianRussianSalvadoranSamoanScandinavianScotch-IrishScottishSeminoleSenegaleseSerbianShoshoneSierra LeoneanSiouxSlavicSlovakSloveneSomaliSouth AfricanSouth AmericanSouth American IndianSoviet UnionSpaniardSpanishSpanish AmericanSpanish American IndianSri LankanSubsaharan AfricanSudaneseSwedishSwissSyrianTaiwaneseThaiTlingit-HaidaTohono O'OdhamTonganTrinidadian and TobagonianTsimshianTurkishU.S. Virgin IslanderUgandanUkrainianUruguayanUteVenezuelanVietnameseWelshWest IndianYakamaYaquiYugoslavianYumanYup'ikZimbabwean
Immigration
NonimmigrantsImmigrantsAfghanistanAfricaAlbaniaArgentinaArmeniaAsiaAustraliaAustriaBahamasBangladeshBarbadosBelarusBelgiumBelizeBoliviaBosnia and HerzegovinaBrazilBulgariaBurma/MyanmarCabo VerdeCambodiaCameroonCanadaCaribbeanCentral AmericaChileChinaColombiaCongoCosta RicaCroatiaCubaCzechoslovakiaDenmarkDominicaDominican RepublicEastern AfricaEastern AsiaEastern EuropeEcuadorEgyptEl SalvadorEnglandEritreaEthiopiaEuropeFijiFranceGermanyGhanaGreeceGrenadaGuatemalaGuyanaHaitiHondurasHong KongHungaryIndiaIndonesiaIranIraqIrelandIsraelItalyJamaicaJapanJordanKazakhstanKenyaKoreaKuwaitLaosLatin AmericaLatviaLebanonLiberiaLithuaniaMalaysiaMexicoMicronesiaMiddle AfricaMoldovaMoroccoNepalNetherlandsNicaraguaNigeriaNorth AmericaNorth MacedoniaNorthern AfricaNorthern EuropeNorwayOceaniaPakistanPanamaPeruPhilippinesPolandPortugalRomaniaRussiaSaudi ArabiaScotlandSenegalSerbiaSierra LeoneSingaporeSomaliaSouth AfricaSouth AmericaSouth Central AsiaSouth Eastern AsiaSouthern EuropeSpainSri LankaSt. Vincent and the GrenadinesSudanSwedenSwitzerlandSyriaTaiwanThailandTrinidad and TobagoTurkeyUgandaUkraineUruguayUzbekistanVenezuelaVietnamWest IndiesWestern AfricaWestern AsiaWestern EuropeYemenZaireZimbabweAzores
Delaware
Race
Ancestry
AfghanAfricanAlaska NativeAlaskan AthabascanAlbanianAleutAlsatianAmericanApacheArabArapahoArgentineanArmenianAssyrian/Chaldean/SyriacAustralianAustrianBahamianBangladeshiBarbadianBasqueBelgianBelizeanBermudanBhutaneseBlackfeetBolivianBrazilianBritishBritish West IndianBulgarianBurmeseCajunCambodianCanadianCape VerdeanCarpatho RusynCelticCentral AmericanCentral American IndianCherokeeCheyenneChickasawChileanChineseChippewaChoctawColombianColvilleComancheCosta RicanCreeCreekCroatianCrowCubanCypriotCzechCzechoslovakianDanishDelawareDominicanDutchDutch West IndianEastern EuropeanEcuadorianEgyptianEnglishEstonianEthiopianEuropeanFijianFilipinoFinnishFrenchFrench American IndianFrench CanadianGermanGerman RussianGhanaianGreekGuamanian/ChamorroGuatemalanGuyaneseHaitianHmongHonduranHopiHoumaHungarianIcelanderIndian (Asian)IndonesianInupiatIranianIraqiIrishIroquoisIsraeliItalianJamaicanJapaneseJordanianKenyanKiowaKoreanLaotianLatvianLebaneseLiberianLithuanianLumbeeLuxembourgerMacedonianMalaysianMalteseMarshalleseMenomineeMexicanMexican American IndianMongolianMoroccanNative HawaiianNavajoNepaleseNew ZealanderNicaraguanNigerianNorthern EuropeanNorwegianOkinawanOsageOttawaPaiutePakistaniPalestinianPanamanianParaguayanPennsylvania GermanPeruvianPimaPolishPortuguesePotawatomiPuebloPuerto RicanPuget Sound SalishRomanianRussianSalvadoranSamoanScandinavianScotch-IrishScottishSeminoleSenegaleseSerbianShoshoneSierra LeoneanSiouxSlavicSlovakSloveneSomaliSouth AfricanSouth AmericanSouth American IndianSoviet UnionSpaniardSpanishSpanish AmericanSpanish American IndianSri LankanSubsaharan AfricanSudaneseSwedishSwissSyrianTaiwaneseThaiTlingit-HaidaTohono O'OdhamTonganTrinidadian and TobagonianTsimshianTurkishU.S. Virgin IslanderUgandanUkrainianUruguayanUteVenezuelanVietnameseWelshWest IndianYakamaYaquiYugoslavianYumanYup'ikZimbabwean
Immigration
NonimmigrantsImmigrantsAfghanistanAfricaAlbaniaArgentinaArmeniaAsiaAustraliaAustriaBahamasBangladeshBarbadosBelarusBelgiumBelizeBoliviaBosnia and HerzegovinaBrazilBulgariaBurma/MyanmarCabo VerdeCambodiaCameroonCanadaCaribbeanCentral AmericaChileChinaColombiaCongoCosta RicaCroatiaCubaCzechoslovakiaDenmarkDominicaDominican RepublicEastern AfricaEastern AsiaEastern EuropeEcuadorEgyptEl SalvadorEnglandEritreaEthiopiaEuropeFijiFranceGermanyGhanaGreeceGrenadaGuatemalaGuyanaHaitiHondurasHong KongHungaryIndiaIndonesiaIranIraqIrelandIsraelItalyJamaicaJapanJordanKazakhstanKenyaKoreaKuwaitLaosLatin AmericaLatviaLebanonLiberiaLithuaniaMalaysiaMexicoMicronesiaMoldovaMoroccoNepalNetherlandsNicaraguaNigeriaNorth AmericaNorth MacedoniaNorthern AfricaNorthern EuropeNorwayOceaniaPakistanPanamaPeruPhilippinesPolandPortugalRomaniaRussiaSaudi ArabiaScotlandSenegalSerbiaSierra LeoneSingaporeSomaliaSouth AfricaSouth AmericaSouth Central AsiaSouth Eastern AsiaSouthern EuropeSpainSri LankaSt. Vincent and the GrenadinesSudanSwedenSwitzerlandSyriaTaiwanThailandTrinidad and TobagoTurkeyUgandaUkraineUruguayUzbekistanVenezuelaVietnamWest IndiesWestern AfricaWestern AsiaWestern EuropeYemenZaireZimbabweAzores
Householder Income Ages 25 - 44 years
Income
Poverty
Unemployment
Labor Participation
Family Structure
Vehicle Availability
Education Level
Disability

Householder Income Ages 25 - 44 years Comparison

Immigrants from Middle Africa

Delaware

Tragic
Tragic
$82,254
HOUSEHOLDER INCOME AGES 25 - 44 YEARS
0.1/ 100
METRIC RATING
284th/ 347
METRIC RANK
$89,876
HOUSEHOLDER INCOME AGES 25 - 44 YEARS
6.9/ 100
METRIC RATING
219th/ 347
METRIC RANK

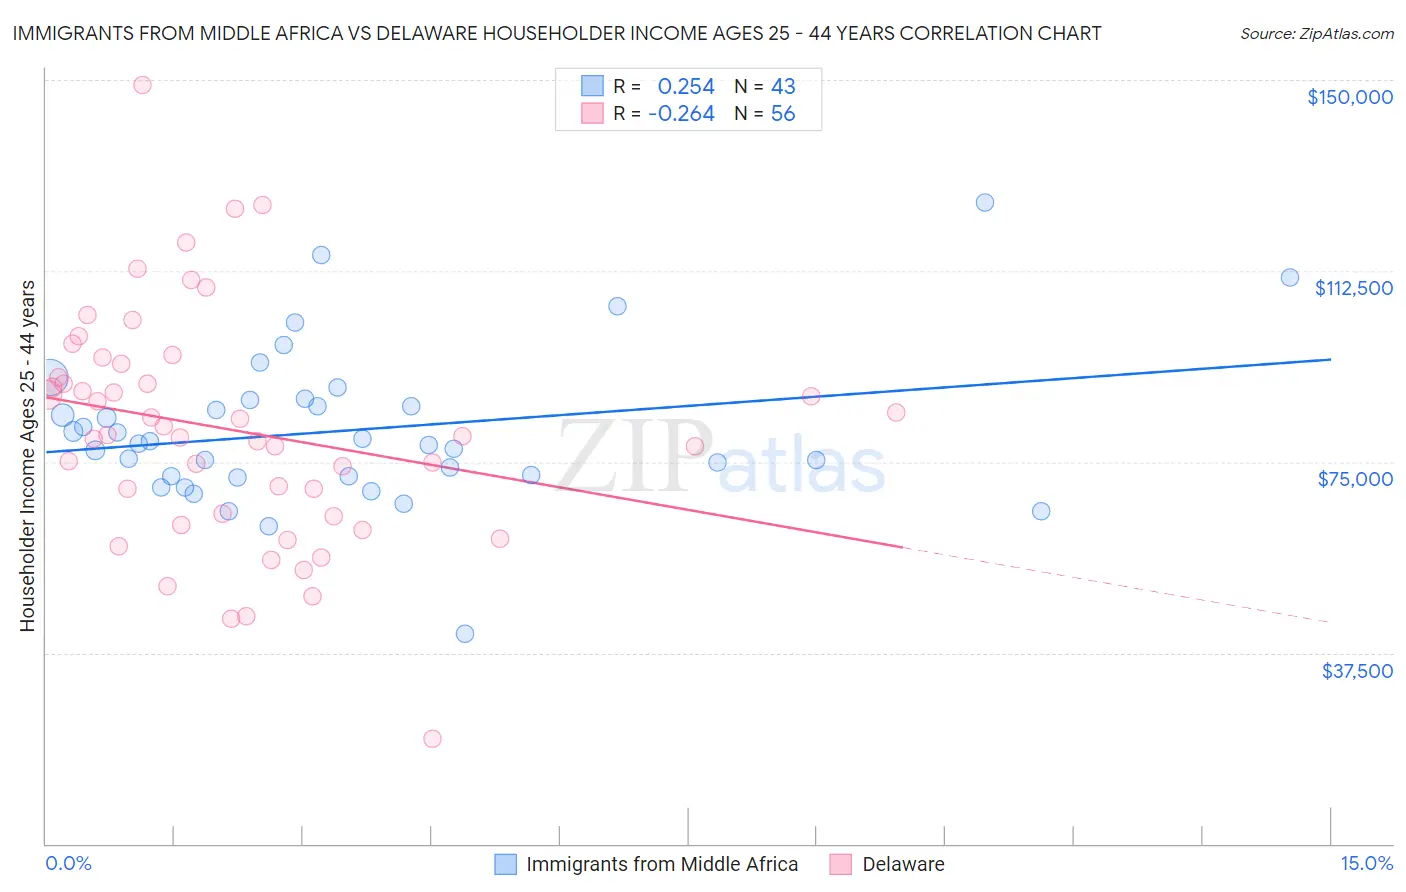
Immigrants from Middle Africa vs Delaware Householder Income Ages 25 - 44 years Correlation Chart

The statistical analysis conducted on geographies consisting of 202,520,719 people shows a weak positive correlation between the proportion of Immigrants from Middle Africa and household income with householder between the ages 25 and 44 in the United States with a correlation coefficient (R) of 0.254 and weighted average of $82,254. Similarly, the statistical analysis conducted on geographies consisting of 96,132,601 people shows a weak negative correlation between the proportion of Delaware and household income with householder between the ages 25 and 44 in the United States with a correlation coefficient (R) of -0.264 and weighted average of $89,876, a difference of 9.3%.
Immigrants from Middle Africa vs Delaware Householder Income Ages 25 - 44 years

Householder Income Ages 25 - 44 years Correlation Summary

MeasurementImmigrants from Middle AfricaDelaware
Minimum$41,159$20,625
Maximum$125,889$148,987
Range$84,730$128,362
Mean$81,156$81,167
Median$78,481$80,133
Interquartile 25% (IQ1)$72,155$64,556
Interquartile 75% (IQ3)$87,087$92,864
Interquartile Range (IQR)$14,931$28,308
Standard Deviation (Sample)$15,197$22,962
Standard Deviation (Population)$15,019$22,756

Similar Demographics by Householder Income Ages 25 - 44 years

Demographics Similar to Immigrants from Middle Africa by Householder Income Ages 25 - 44 years

In terms of householder income ages 25 - 44 years, the demographic groups most similar to Immigrants from Middle Africa are Immigrants from Somalia ($82,188, a difference of 0.080%), Guatemalan ($82,331, a difference of 0.090%), Ute ($82,166, a difference of 0.11%), Immigrants from Latin America ($82,166, a difference of 0.11%), and Central American Indian ($82,355, a difference of 0.12%).
DemographicsRating | RankHouseholder Income Ages 25 - 44 years
Paiute
0.2
/100
|
#277
Tragic
$82,984
Senegalese
0.2
/100
|
#278
Tragic
$82,852
Pima
0.1
/100
|
#279
Tragic
$82,821
Colville
0.1
/100
|
#280
Tragic
$82,604
Cajuns
0.1
/100
|
#281
Tragic
$82,393
Central American Indians
0.1
/100
|
#282
Tragic
$82,355
Guatemalans
0.1
/100
|
#283
Tragic
$82,331
Immigrants | Middle Africa
0.1
/100
|
#284
Tragic
$82,254
Immigrants | Somalia
0.1
/100
|
#285
Tragic
$82,188
Ute
0.1
/100
|
#286
Tragic
$82,166
Immigrants | Latin America
0.1
/100
|
#287
Tragic
$82,166
Comanche
0.1
/100
|
#288
Tragic
$82,152
Shoshone
0.1
/100
|
#289
Tragic
$82,062
Liberians
0.1
/100
|
#290
Tragic
$82,005
Potawatomi
0.1
/100
|
#291
Tragic
$81,774

Demographics Similar to Delaware by Householder Income Ages 25 - 44 years

In terms of householder income ages 25 - 44 years, the demographic groups most similar to Delaware are Trinidadian and Tobagonian ($89,856, a difference of 0.020%), Guyanese ($89,940, a difference of 0.070%), Scotch-Irish ($89,969, a difference of 0.10%), Immigrants from Trinidad and Tobago ($89,748, a difference of 0.14%), and Immigrants from Ecuador ($89,673, a difference of 0.23%).
DemographicsRating | RankHouseholder Income Ages 25 - 44 years
Hawaiians
10.6
/100
|
#212
Poor
$90,722
Immigrants | Bangladesh
9.3
/100
|
#213
Tragic
$90,448
Immigrants | Africa
8.9
/100
|
#214
Tragic
$90,372
Panamanians
8.1
/100
|
#215
Tragic
$90,193
Ghanaians
7.9
/100
|
#216
Tragic
$90,137
Scotch-Irish
7.3
/100
|
#217
Tragic
$89,969
Guyanese
7.1
/100
|
#218
Tragic
$89,940
Delaware
6.9
/100
|
#219
Tragic
$89,876
Trinidadians and Tobagonians
6.8
/100
|
#220
Tragic
$89,856
Immigrants | Trinidad and Tobago
6.5
/100
|
#221
Tragic
$89,748
Immigrants | Ecuador
6.2
/100
|
#222
Tragic
$89,673
Immigrants | Guyana
5.9
/100
|
#223
Tragic
$89,586
Barbadians
5.9
/100
|
#224
Tragic
$89,565
Immigrants | Panama
5.5
/100
|
#225
Tragic
$89,451
Immigrants | Iraq
5.5
/100
|
#226
Tragic
$89,444