Immigrants from Middle Africa vs Immigrants from Sri Lanka Householder Income Ages 25 - 44 years
COMPARE
Immigrants from Middle Africa
Immigrants from Sri Lanka
Householder Income Ages 25 - 44 years
Householder Income Ages 25 - 44 years Comparison
Immigrants from Middle Africa
Immigrants from Sri Lanka
$82,254
HOUSEHOLDER INCOME AGES 25 - 44 YEARS
0.1/ 100
METRIC RATING
284th/ 347
METRIC RANK
$109,741
HOUSEHOLDER INCOME AGES 25 - 44 YEARS
100.0/ 100
METRIC RATING
32nd/ 347
METRIC RANK
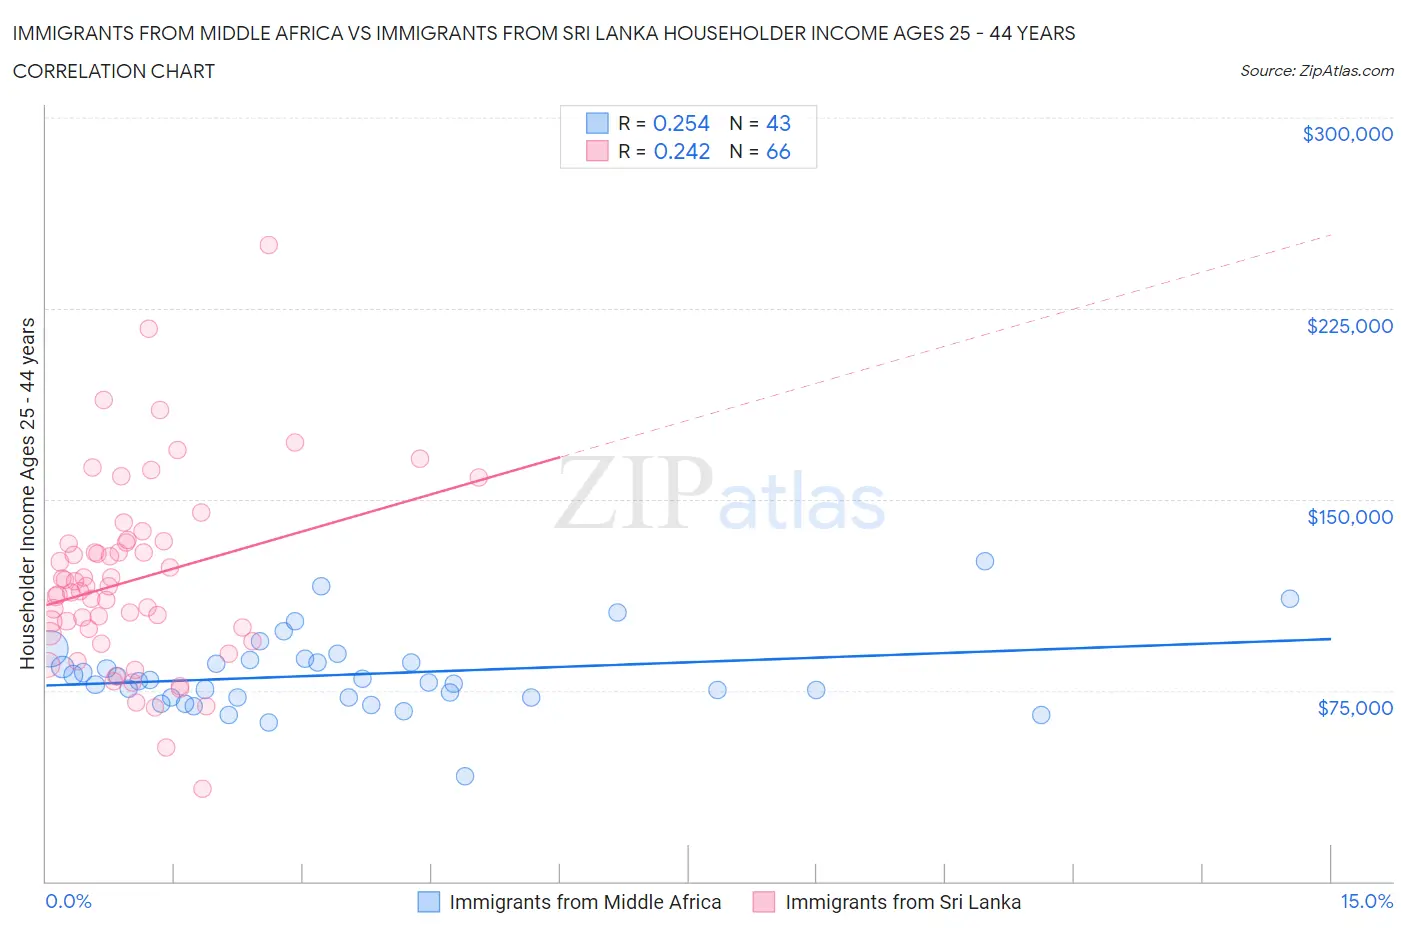
Immigrants from Middle Africa vs Immigrants from Sri Lanka Householder Income Ages 25 - 44 years Correlation Chart
The statistical analysis conducted on geographies consisting of 202,520,719 people shows a weak positive correlation between the proportion of Immigrants from Middle Africa and household income with householder between the ages 25 and 44 in the United States with a correlation coefficient (R) of 0.254 and weighted average of $82,254. Similarly, the statistical analysis conducted on geographies consisting of 149,615,906 people shows a weak positive correlation between the proportion of Immigrants from Sri Lanka and household income with householder between the ages 25 and 44 in the United States with a correlation coefficient (R) of 0.242 and weighted average of $109,741, a difference of 33.4%.
Householder Income Ages 25 - 44 years Correlation Summary
| Measurement | Immigrants from Middle Africa | Immigrants from Sri Lanka |
| Minimum | $41,159 | $36,230 |
| Maximum | $125,889 | $250,001 |
| Range | $84,730 | $213,771 |
| Mean | $81,156 | $118,421 |
| Median | $78,481 | $114,758 |
| Interquartile 25% (IQ1) | $72,155 | $97,290 |
| Interquartile 75% (IQ3) | $87,087 | $133,038 |
| Interquartile Range (IQR) | $14,931 | $35,748 |
| Standard Deviation (Sample) | $15,197 | $37,121 |
| Standard Deviation (Population) | $15,019 | $36,839 |
Similar Demographics by Householder Income Ages 25 - 44 years
Demographics Similar to Immigrants from Middle Africa by Householder Income Ages 25 - 44 years
In terms of householder income ages 25 - 44 years, the demographic groups most similar to Immigrants from Middle Africa are Immigrants from Somalia ($82,188, a difference of 0.080%), Guatemalan ($82,331, a difference of 0.090%), Ute ($82,166, a difference of 0.11%), Immigrants from Latin America ($82,166, a difference of 0.11%), and Central American Indian ($82,355, a difference of 0.12%).
| Demographics | Rating | Rank | Householder Income Ages 25 - 44 years |
| Paiute | 0.2 /100 | #277 | Tragic $82,984 |
| Senegalese | 0.2 /100 | #278 | Tragic $82,852 |
| Pima | 0.1 /100 | #279 | Tragic $82,821 |
| Colville | 0.1 /100 | #280 | Tragic $82,604 |
| Cajuns | 0.1 /100 | #281 | Tragic $82,393 |
| Central American Indians | 0.1 /100 | #282 | Tragic $82,355 |
| Guatemalans | 0.1 /100 | #283 | Tragic $82,331 |
| Immigrants | Middle Africa | 0.1 /100 | #284 | Tragic $82,254 |
| Immigrants | Somalia | 0.1 /100 | #285 | Tragic $82,188 |
| Ute | 0.1 /100 | #286 | Tragic $82,166 |
| Immigrants | Latin America | 0.1 /100 | #287 | Tragic $82,166 |
| Comanche | 0.1 /100 | #288 | Tragic $82,152 |
| Shoshone | 0.1 /100 | #289 | Tragic $82,062 |
| Liberians | 0.1 /100 | #290 | Tragic $82,005 |
| Potawatomi | 0.1 /100 | #291 | Tragic $81,774 |
Demographics Similar to Immigrants from Sri Lanka by Householder Income Ages 25 - 44 years
In terms of householder income ages 25 - 44 years, the demographic groups most similar to Immigrants from Sri Lanka are Bhutanese ($109,520, a difference of 0.20%), Maltese ($110,064, a difference of 0.29%), Immigrants from Greece ($110,103, a difference of 0.33%), Bolivian ($109,372, a difference of 0.34%), and Immigrants from Switzerland ($109,185, a difference of 0.51%).
| Demographics | Rating | Rank | Householder Income Ages 25 - 44 years |
| Immigrants | Northern Europe | 100.0 /100 | #25 | Exceptional $111,676 |
| Immigrants | Asia | 100.0 /100 | #26 | Exceptional $110,787 |
| Russians | 100.0 /100 | #27 | Exceptional $110,398 |
| Immigrants | Denmark | 100.0 /100 | #28 | Exceptional $110,363 |
| Turks | 100.0 /100 | #29 | Exceptional $110,318 |
| Immigrants | Greece | 100.0 /100 | #30 | Exceptional $110,103 |
| Maltese | 100.0 /100 | #31 | Exceptional $110,064 |
| Immigrants | Sri Lanka | 100.0 /100 | #32 | Exceptional $109,741 |
| Bhutanese | 100.0 /100 | #33 | Exceptional $109,520 |
| Bolivians | 100.0 /100 | #34 | Exceptional $109,372 |
| Immigrants | Switzerland | 100.0 /100 | #35 | Exceptional $109,185 |
| Latvians | 100.0 /100 | #36 | Exceptional $108,926 |
| Immigrants | Russia | 100.0 /100 | #37 | Exceptional $108,751 |
| Soviet Union | 100.0 /100 | #38 | Exceptional $108,457 |
| Immigrants | France | 99.9 /100 | #39 | Exceptional $108,257 |