Immigrants from Micronesia vs Samoan Householder Income Ages 25 - 44 years
COMPARE
Immigrants from Micronesia
Samoan
Householder Income Ages 25 - 44 years
Householder Income Ages 25 - 44 years Comparison
Immigrants from Micronesia
Samoans
$80,544
HOUSEHOLDER INCOME AGES 25 - 44 YEARS
0.0/ 100
METRIC RATING
301st/ 347
METRIC RANK
$92,385
HOUSEHOLDER INCOME AGES 25 - 44 YEARS
23.0/ 100
METRIC RATING
193rd/ 347
METRIC RANK
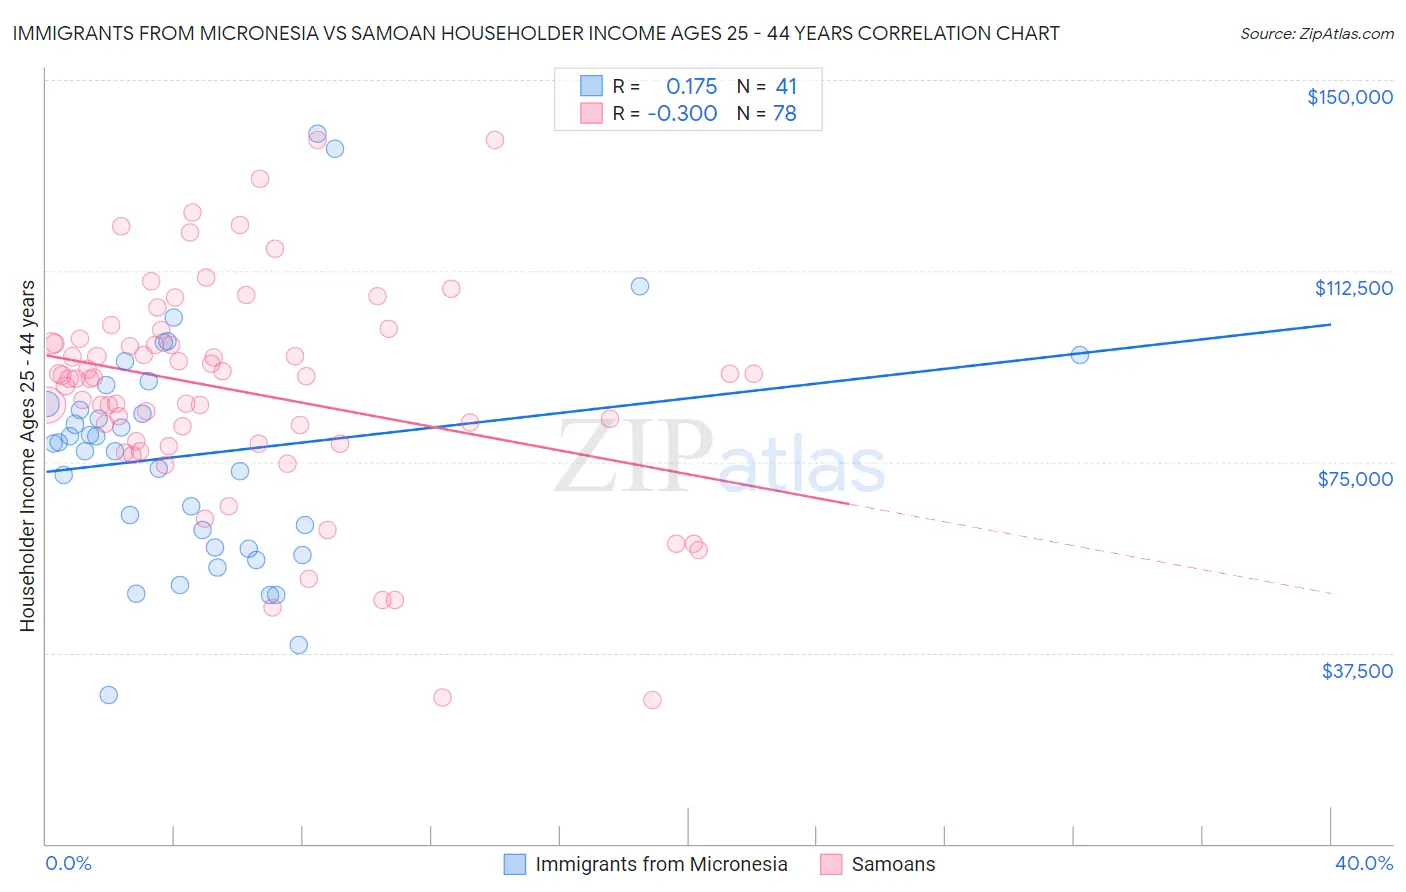
Immigrants from Micronesia vs Samoan Householder Income Ages 25 - 44 years Correlation Chart
The statistical analysis conducted on geographies consisting of 61,580,291 people shows a poor positive correlation between the proportion of Immigrants from Micronesia and household income with householder between the ages 25 and 44 in the United States with a correlation coefficient (R) of 0.175 and weighted average of $80,544. Similarly, the statistical analysis conducted on geographies consisting of 224,893,183 people shows a mild negative correlation between the proportion of Samoans and household income with householder between the ages 25 and 44 in the United States with a correlation coefficient (R) of -0.300 and weighted average of $92,385, a difference of 14.7%.
Householder Income Ages 25 - 44 years Correlation Summary
| Measurement | Immigrants from Micronesia | Samoan |
| Minimum | $29,188 | $28,250 |
| Maximum | $139,375 | $138,313 |
| Range | $110,187 | $110,063 |
| Mean | $76,482 | $88,852 |
| Median | $78,666 | $91,500 |
| Interquartile 25% (IQ1) | $58,006 | $78,594 |
| Interquartile 75% (IQ3) | $88,259 | $98,319 |
| Interquartile Range (IQR) | $30,252 | $19,725 |
| Standard Deviation (Sample) | $22,989 | $21,577 |
| Standard Deviation (Population) | $22,707 | $21,438 |
Similar Demographics by Householder Income Ages 25 - 44 years
Demographics Similar to Immigrants from Micronesia by Householder Income Ages 25 - 44 years
In terms of householder income ages 25 - 44 years, the demographic groups most similar to Immigrants from Micronesia are Hispanic or Latino ($80,515, a difference of 0.040%), Mexican ($80,427, a difference of 0.14%), Immigrants from Caribbean ($80,326, a difference of 0.27%), Immigrants from Dominican Republic ($80,319, a difference of 0.28%), and Apache ($80,260, a difference of 0.35%).
| Demographics | Rating | Rank | Householder Income Ages 25 - 44 years |
| Cubans | 0.1 /100 | #294 | Tragic $81,483 |
| Bangladeshis | 0.1 /100 | #295 | Tragic $81,363 |
| Immigrants | Dominica | 0.1 /100 | #296 | Tragic $81,351 |
| Immigrants | Guatemala | 0.1 /100 | #297 | Tragic $81,341 |
| Dominicans | 0.1 /100 | #298 | Tragic $81,229 |
| Immigrants | Liberia | 0.1 /100 | #299 | Tragic $80,863 |
| Cherokee | 0.0 /100 | #300 | Tragic $80,843 |
| Immigrants | Micronesia | 0.0 /100 | #301 | Tragic $80,544 |
| Hispanics or Latinos | 0.0 /100 | #302 | Tragic $80,515 |
| Mexicans | 0.0 /100 | #303 | Tragic $80,427 |
| Immigrants | Caribbean | 0.0 /100 | #304 | Tragic $80,326 |
| Immigrants | Dominican Republic | 0.0 /100 | #305 | Tragic $80,319 |
| Apache | 0.0 /100 | #306 | Tragic $80,260 |
| Haitians | 0.0 /100 | #307 | Tragic $80,055 |
| Immigrants | Central America | 0.0 /100 | #308 | Tragic $80,012 |
Demographics Similar to Samoans by Householder Income Ages 25 - 44 years
In terms of householder income ages 25 - 44 years, the demographic groups most similar to Samoans are Immigrants from the Azores ($92,322, a difference of 0.070%), Celtic ($92,241, a difference of 0.16%), Immigrants from Colombia ($92,204, a difference of 0.20%), Spanish ($92,200, a difference of 0.20%), and Vietnamese ($92,089, a difference of 0.32%).
| Demographics | Rating | Rank | Householder Income Ages 25 - 44 years |
| Sierra Leoneans | 34.8 /100 | #186 | Fair $93,435 |
| Spaniards | 34.0 /100 | #187 | Fair $93,366 |
| Immigrants | Sierra Leone | 30.9 /100 | #188 | Fair $93,115 |
| Dutch | 30.5 /100 | #189 | Fair $93,081 |
| Welsh | 30.0 /100 | #190 | Fair $93,039 |
| Tlingit-Haida | 29.4 /100 | #191 | Fair $92,987 |
| Immigrants | Costa Rica | 28.2 /100 | #192 | Fair $92,876 |
| Samoans | 23.0 /100 | #193 | Fair $92,385 |
| Immigrants | Azores | 22.4 /100 | #194 | Fair $92,322 |
| Celtics | 21.6 /100 | #195 | Fair $92,241 |
| Immigrants | Colombia | 21.3 /100 | #196 | Fair $92,204 |
| Spanish | 21.2 /100 | #197 | Fair $92,200 |
| Vietnamese | 20.2 /100 | #198 | Fair $92,089 |
| Kenyans | 16.8 /100 | #199 | Poor $91,684 |
| Whites/Caucasians | 16.7 /100 | #200 | Poor $91,668 |