Immigrants from Micronesia vs Slovene Householder Income Ages 25 - 44 years
COMPARE
Immigrants from Micronesia
Slovene
Householder Income Ages 25 - 44 years
Householder Income Ages 25 - 44 years Comparison
Immigrants from Micronesia
Slovenes
$80,544
HOUSEHOLDER INCOME AGES 25 - 44 YEARS
0.0/ 100
METRIC RATING
301st/ 347
METRIC RANK
$96,439
HOUSEHOLDER INCOME AGES 25 - 44 YEARS
73.9/ 100
METRIC RATING
153rd/ 347
METRIC RANK
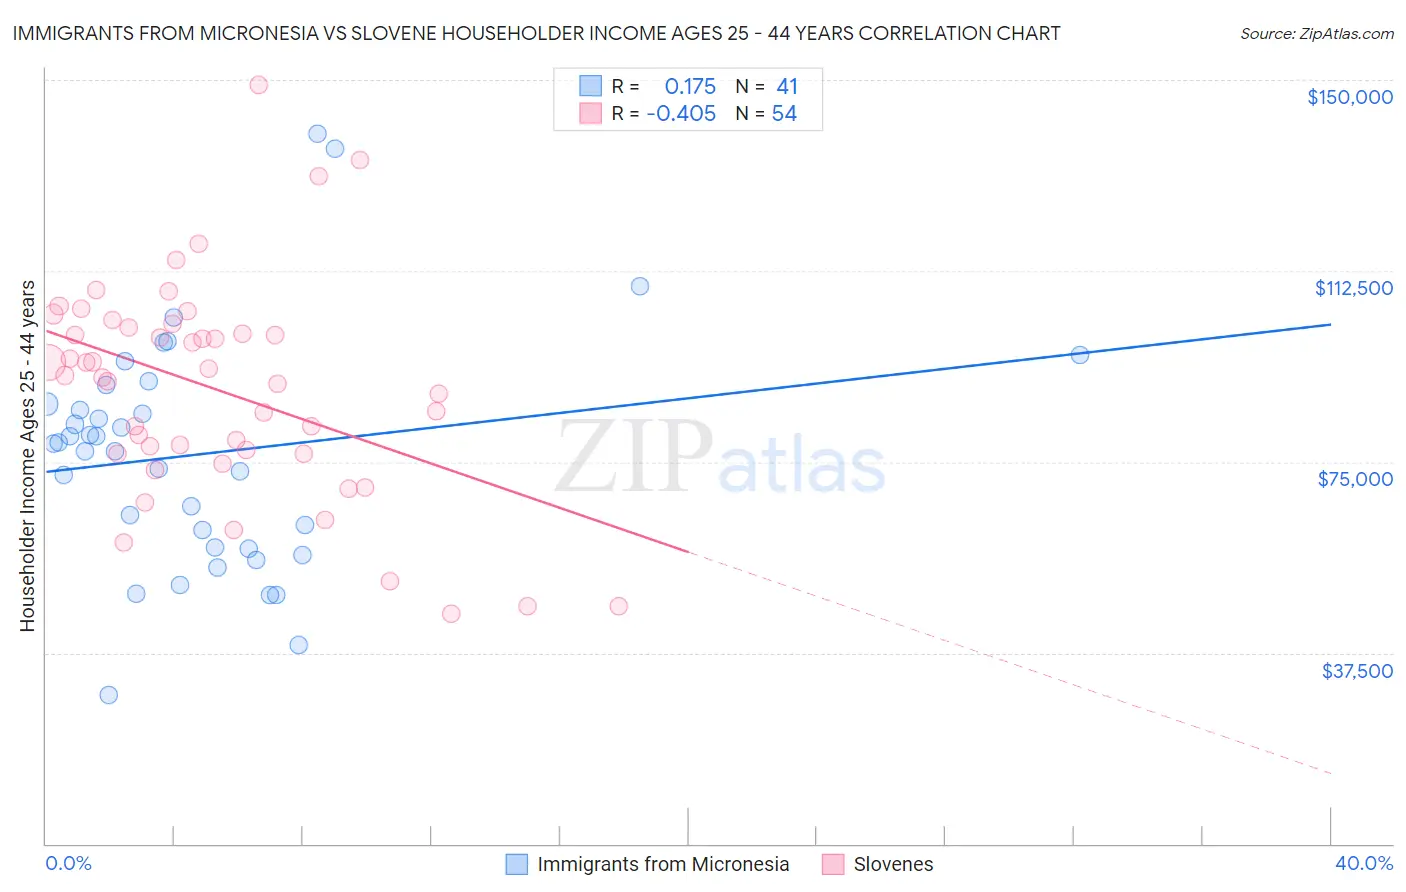
Immigrants from Micronesia vs Slovene Householder Income Ages 25 - 44 years Correlation Chart
The statistical analysis conducted on geographies consisting of 61,580,291 people shows a poor positive correlation between the proportion of Immigrants from Micronesia and household income with householder between the ages 25 and 44 in the United States with a correlation coefficient (R) of 0.175 and weighted average of $80,544. Similarly, the statistical analysis conducted on geographies consisting of 260,772,940 people shows a moderate negative correlation between the proportion of Slovenes and household income with householder between the ages 25 and 44 in the United States with a correlation coefficient (R) of -0.405 and weighted average of $96,439, a difference of 19.7%.
Householder Income Ages 25 - 44 years Correlation Summary
| Measurement | Immigrants from Micronesia | Slovene |
| Minimum | $29,188 | $45,114 |
| Maximum | $139,375 | $149,005 |
| Range | $110,187 | $103,891 |
| Mean | $76,482 | $89,263 |
| Median | $78,666 | $91,712 |
| Interquartile 25% (IQ1) | $58,006 | $76,661 |
| Interquartile 75% (IQ3) | $88,259 | $101,430 |
| Interquartile Range (IQR) | $30,252 | $24,769 |
| Standard Deviation (Sample) | $22,989 | $21,285 |
| Standard Deviation (Population) | $22,707 | $21,087 |
Similar Demographics by Householder Income Ages 25 - 44 years
Demographics Similar to Immigrants from Micronesia by Householder Income Ages 25 - 44 years
In terms of householder income ages 25 - 44 years, the demographic groups most similar to Immigrants from Micronesia are Hispanic or Latino ($80,515, a difference of 0.040%), Mexican ($80,427, a difference of 0.14%), Immigrants from Caribbean ($80,326, a difference of 0.27%), Immigrants from Dominican Republic ($80,319, a difference of 0.28%), and Apache ($80,260, a difference of 0.35%).
| Demographics | Rating | Rank | Householder Income Ages 25 - 44 years |
| Cubans | 0.1 /100 | #294 | Tragic $81,483 |
| Bangladeshis | 0.1 /100 | #295 | Tragic $81,363 |
| Immigrants | Dominica | 0.1 /100 | #296 | Tragic $81,351 |
| Immigrants | Guatemala | 0.1 /100 | #297 | Tragic $81,341 |
| Dominicans | 0.1 /100 | #298 | Tragic $81,229 |
| Immigrants | Liberia | 0.1 /100 | #299 | Tragic $80,863 |
| Cherokee | 0.0 /100 | #300 | Tragic $80,843 |
| Immigrants | Micronesia | 0.0 /100 | #301 | Tragic $80,544 |
| Hispanics or Latinos | 0.0 /100 | #302 | Tragic $80,515 |
| Mexicans | 0.0 /100 | #303 | Tragic $80,427 |
| Immigrants | Caribbean | 0.0 /100 | #304 | Tragic $80,326 |
| Immigrants | Dominican Republic | 0.0 /100 | #305 | Tragic $80,319 |
| Apache | 0.0 /100 | #306 | Tragic $80,260 |
| Haitians | 0.0 /100 | #307 | Tragic $80,055 |
| Immigrants | Central America | 0.0 /100 | #308 | Tragic $80,012 |
Demographics Similar to Slovenes by Householder Income Ages 25 - 44 years
In terms of householder income ages 25 - 44 years, the demographic groups most similar to Slovenes are South American Indian ($96,497, a difference of 0.060%), Slavic ($96,377, a difference of 0.060%), Czech ($96,525, a difference of 0.090%), Ugandan ($96,667, a difference of 0.24%), and Basque ($96,709, a difference of 0.28%).
| Demographics | Rating | Rank | Householder Income Ages 25 - 44 years |
| Ethiopians | 77.8 /100 | #146 | Good $96,824 |
| Immigrants | Syria | 77.4 /100 | #147 | Good $96,789 |
| Irish | 76.9 /100 | #148 | Good $96,730 |
| Basques | 76.6 /100 | #149 | Good $96,709 |
| Ugandans | 76.2 /100 | #150 | Good $96,667 |
| Czechs | 74.8 /100 | #151 | Good $96,525 |
| South American Indians | 74.5 /100 | #152 | Good $96,497 |
| Slovenes | 73.9 /100 | #153 | Good $96,439 |
| Slavs | 73.2 /100 | #154 | Good $96,377 |
| Moroccans | 70.3 /100 | #155 | Good $96,117 |
| Immigrants | Germany | 67.9 /100 | #156 | Good $95,913 |
| Immigrants | Uganda | 65.2 /100 | #157 | Good $95,698 |
| Scandinavians | 63.9 /100 | #158 | Good $95,596 |
| Costa Ricans | 63.5 /100 | #159 | Good $95,565 |
| Icelanders | 63.4 /100 | #160 | Good $95,560 |