Laotian vs Samoan Householder Income Ages 25 - 44 years
COMPARE
Laotian
Samoan
Householder Income Ages 25 - 44 years
Householder Income Ages 25 - 44 years Comparison
Laotians
Samoans
$104,993
HOUSEHOLDER INCOME AGES 25 - 44 YEARS
99.7/ 100
METRIC RATING
66th/ 347
METRIC RANK
$92,385
HOUSEHOLDER INCOME AGES 25 - 44 YEARS
23.0/ 100
METRIC RATING
193rd/ 347
METRIC RANK
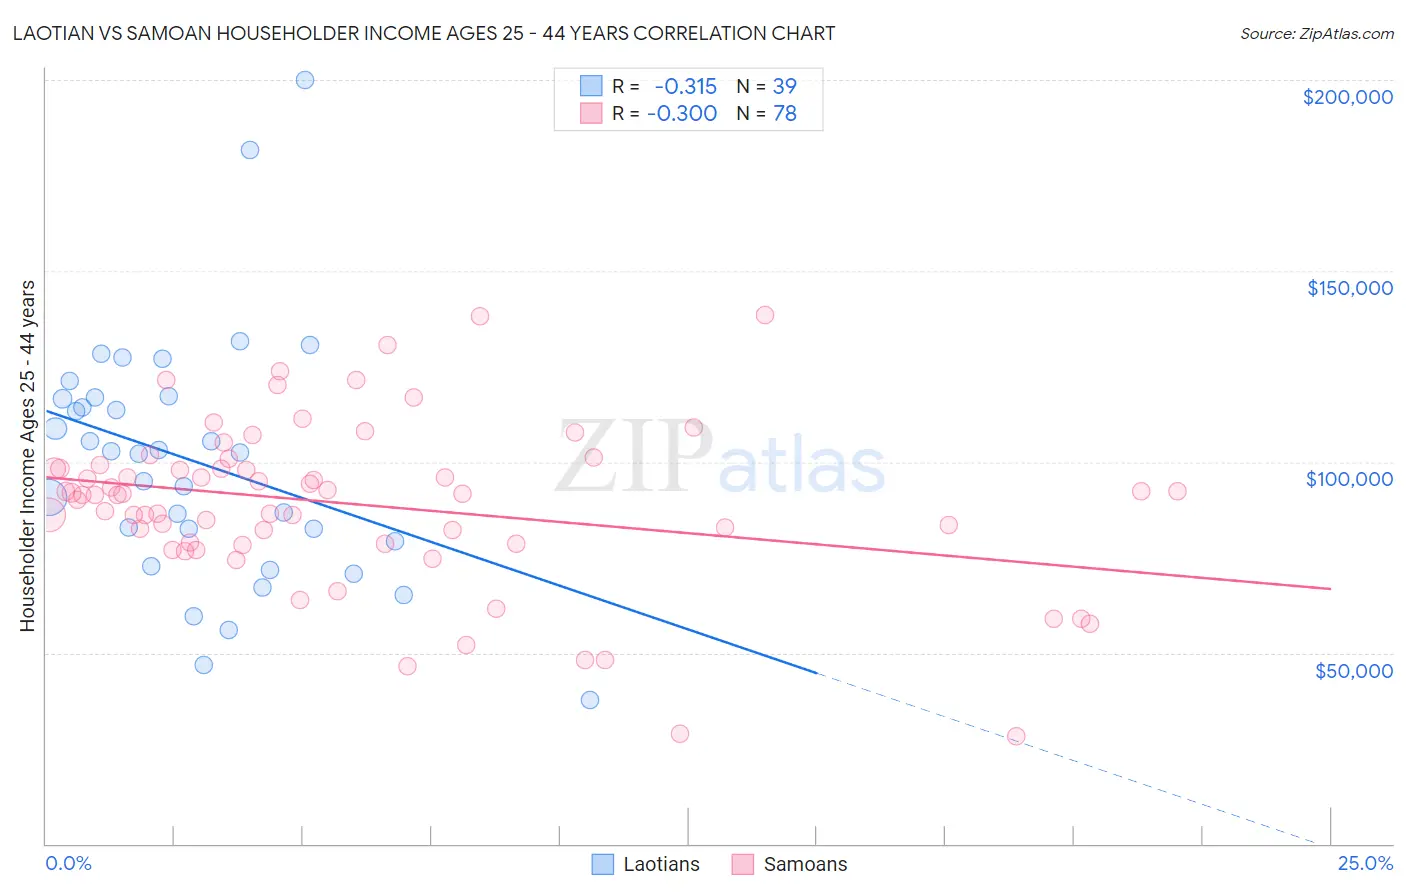
Laotian vs Samoan Householder Income Ages 25 - 44 years Correlation Chart
The statistical analysis conducted on geographies consisting of 224,507,973 people shows a mild negative correlation between the proportion of Laotians and household income with householder between the ages 25 and 44 in the United States with a correlation coefficient (R) of -0.315 and weighted average of $104,993. Similarly, the statistical analysis conducted on geographies consisting of 224,893,183 people shows a mild negative correlation between the proportion of Samoans and household income with householder between the ages 25 and 44 in the United States with a correlation coefficient (R) of -0.300 and weighted average of $92,385, a difference of 13.7%.
Householder Income Ages 25 - 44 years Correlation Summary
| Measurement | Laotian | Samoan |
| Minimum | $37,722 | $28,250 |
| Maximum | $199,931 | $138,313 |
| Range | $162,209 | $110,063 |
| Mean | $99,903 | $88,852 |
| Median | $102,522 | $91,500 |
| Interquartile 25% (IQ1) | $79,125 | $78,594 |
| Interquartile 75% (IQ3) | $116,790 | $98,319 |
| Interquartile Range (IQR) | $37,665 | $19,725 |
| Standard Deviation (Sample) | $32,336 | $21,577 |
| Standard Deviation (Population) | $31,919 | $21,438 |
Similar Demographics by Householder Income Ages 25 - 44 years
Demographics Similar to Laotians by Householder Income Ages 25 - 44 years
In terms of householder income ages 25 - 44 years, the demographic groups most similar to Laotians are Immigrants from Netherlands ($105,082, a difference of 0.080%), Immigrants from Scotland ($105,089, a difference of 0.090%), New Zealander ($105,085, a difference of 0.090%), Immigrants from Italy ($105,201, a difference of 0.20%), and Lithuanian ($105,223, a difference of 0.22%).
| Demographics | Rating | Rank | Householder Income Ages 25 - 44 years |
| Immigrants | Latvia | 99.8 /100 | #59 | Exceptional $105,522 |
| Egyptians | 99.7 /100 | #60 | Exceptional $105,282 |
| Lithuanians | 99.7 /100 | #61 | Exceptional $105,223 |
| Immigrants | Italy | 99.7 /100 | #62 | Exceptional $105,201 |
| Immigrants | Scotland | 99.7 /100 | #63 | Exceptional $105,089 |
| New Zealanders | 99.7 /100 | #64 | Exceptional $105,085 |
| Immigrants | Netherlands | 99.7 /100 | #65 | Exceptional $105,082 |
| Laotians | 99.7 /100 | #66 | Exceptional $104,993 |
| Immigrants | Romania | 99.6 /100 | #67 | Exceptional $104,713 |
| Immigrants | Eastern Europe | 99.6 /100 | #68 | Exceptional $104,662 |
| Mongolians | 99.6 /100 | #69 | Exceptional $104,578 |
| Immigrants | Croatia | 99.6 /100 | #70 | Exceptional $104,503 |
| Afghans | 99.6 /100 | #71 | Exceptional $104,410 |
| Chinese | 99.5 /100 | #72 | Exceptional $104,264 |
| Italians | 99.5 /100 | #73 | Exceptional $104,215 |
Demographics Similar to Samoans by Householder Income Ages 25 - 44 years
In terms of householder income ages 25 - 44 years, the demographic groups most similar to Samoans are Immigrants from the Azores ($92,322, a difference of 0.070%), Celtic ($92,241, a difference of 0.16%), Immigrants from Colombia ($92,204, a difference of 0.20%), Spanish ($92,200, a difference of 0.20%), and Vietnamese ($92,089, a difference of 0.32%).
| Demographics | Rating | Rank | Householder Income Ages 25 - 44 years |
| Sierra Leoneans | 34.8 /100 | #186 | Fair $93,435 |
| Spaniards | 34.0 /100 | #187 | Fair $93,366 |
| Immigrants | Sierra Leone | 30.9 /100 | #188 | Fair $93,115 |
| Dutch | 30.5 /100 | #189 | Fair $93,081 |
| Welsh | 30.0 /100 | #190 | Fair $93,039 |
| Tlingit-Haida | 29.4 /100 | #191 | Fair $92,987 |
| Immigrants | Costa Rica | 28.2 /100 | #192 | Fair $92,876 |
| Samoans | 23.0 /100 | #193 | Fair $92,385 |
| Immigrants | Azores | 22.4 /100 | #194 | Fair $92,322 |
| Celtics | 21.6 /100 | #195 | Fair $92,241 |
| Immigrants | Colombia | 21.3 /100 | #196 | Fair $92,204 |
| Spanish | 21.2 /100 | #197 | Fair $92,200 |
| Vietnamese | 20.2 /100 | #198 | Fair $92,089 |
| Kenyans | 16.8 /100 | #199 | Poor $91,684 |
| Whites/Caucasians | 16.7 /100 | #200 | Poor $91,668 |