Cape Verdean vs Samoan Householder Income Ages 25 - 44 years
COMPARE
Cape Verdean
Samoan
Householder Income Ages 25 - 44 years
Householder Income Ages 25 - 44 years Comparison
Cape Verdeans
Samoans
$85,758
HOUSEHOLDER INCOME AGES 25 - 44 YEARS
0.8/ 100
METRIC RATING
251st/ 347
METRIC RANK
$92,385
HOUSEHOLDER INCOME AGES 25 - 44 YEARS
23.0/ 100
METRIC RATING
193rd/ 347
METRIC RANK
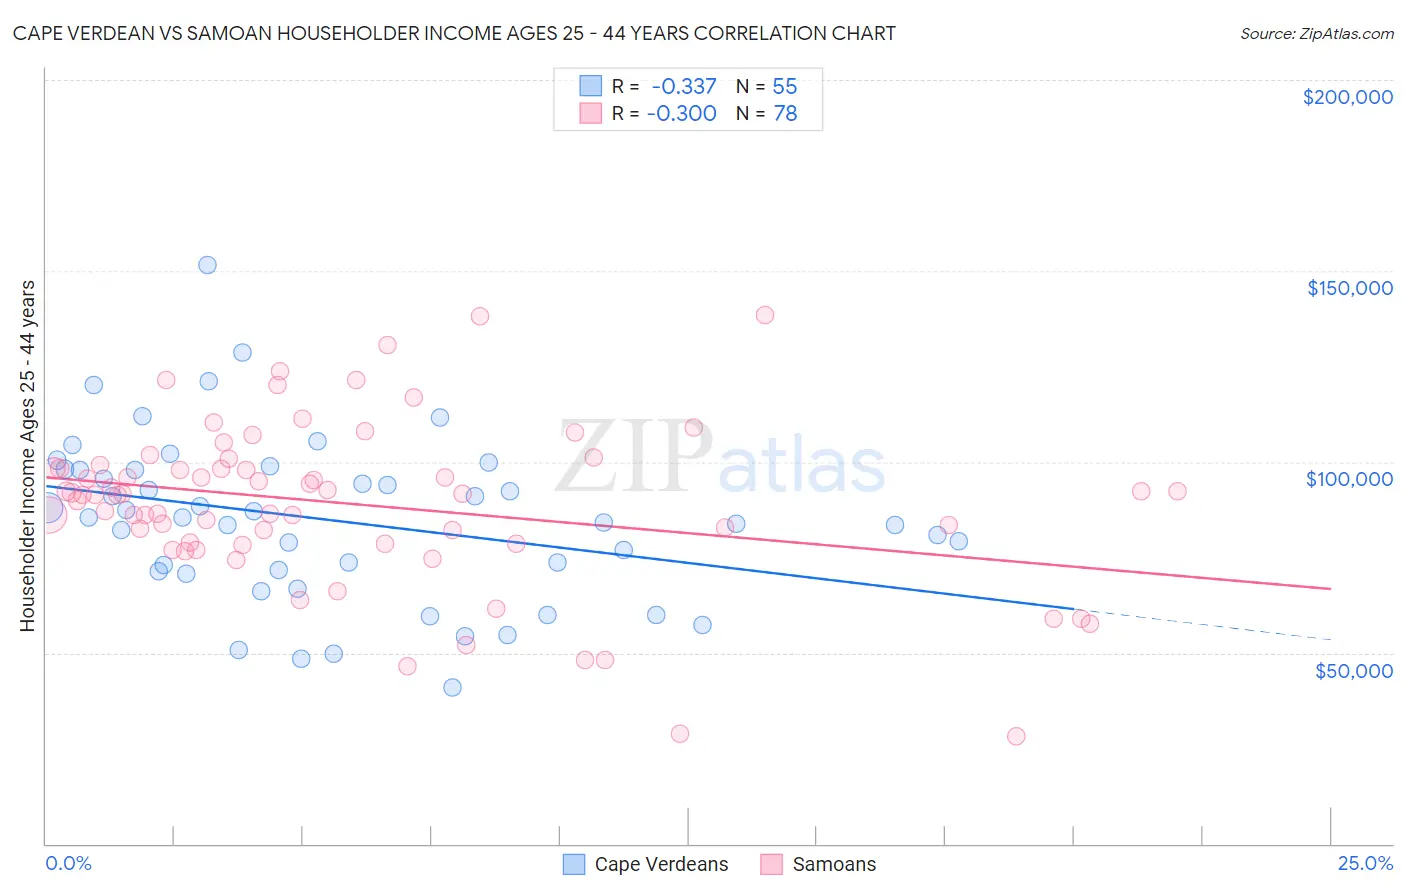
Cape Verdean vs Samoan Householder Income Ages 25 - 44 years Correlation Chart
The statistical analysis conducted on geographies consisting of 107,474,022 people shows a mild negative correlation between the proportion of Cape Verdeans and household income with householder between the ages 25 and 44 in the United States with a correlation coefficient (R) of -0.337 and weighted average of $85,758. Similarly, the statistical analysis conducted on geographies consisting of 224,893,183 people shows a mild negative correlation between the proportion of Samoans and household income with householder between the ages 25 and 44 in the United States with a correlation coefficient (R) of -0.300 and weighted average of $92,385, a difference of 7.7%.
Householder Income Ages 25 - 44 years Correlation Summary
| Measurement | Cape Verdean | Samoan |
| Minimum | $41,033 | $28,250 |
| Maximum | $151,693 | $138,313 |
| Range | $110,660 | $110,063 |
| Mean | $84,702 | $88,852 |
| Median | $85,334 | $91,500 |
| Interquartile 25% (IQ1) | $71,313 | $78,594 |
| Interquartile 75% (IQ3) | $97,942 | $98,319 |
| Interquartile Range (IQR) | $26,629 | $19,725 |
| Standard Deviation (Sample) | $21,551 | $21,577 |
| Standard Deviation (Population) | $21,354 | $21,438 |
Similar Demographics by Householder Income Ages 25 - 44 years
Demographics Similar to Cape Verdeans by Householder Income Ages 25 - 44 years
In terms of householder income ages 25 - 44 years, the demographic groups most similar to Cape Verdeans are Pennsylvania German ($85,836, a difference of 0.090%), Immigrants from Western Africa ($85,676, a difference of 0.10%), French American Indian ($85,899, a difference of 0.16%), British West Indian ($85,565, a difference of 0.23%), and Immigrants from Laos ($85,553, a difference of 0.24%).
| Demographics | Rating | Rank | Householder Income Ages 25 - 44 years |
| Immigrants | Venezuela | 1.5 /100 | #244 | Tragic $87,038 |
| Immigrants | El Salvador | 1.4 /100 | #245 | Tragic $86,913 |
| Immigrants | Burma/Myanmar | 1.3 /100 | #246 | Tragic $86,736 |
| Immigrants | Nigeria | 1.2 /100 | #247 | Tragic $86,589 |
| Immigrants | Sudan | 0.9 /100 | #248 | Tragic $86,109 |
| French American Indians | 0.8 /100 | #249 | Tragic $85,899 |
| Pennsylvania Germans | 0.8 /100 | #250 | Tragic $85,836 |
| Cape Verdeans | 0.8 /100 | #251 | Tragic $85,758 |
| Immigrants | Western Africa | 0.7 /100 | #252 | Tragic $85,676 |
| British West Indians | 0.7 /100 | #253 | Tragic $85,565 |
| Immigrants | Laos | 0.7 /100 | #254 | Tragic $85,553 |
| German Russians | 0.6 /100 | #255 | Tragic $85,220 |
| Central Americans | 0.5 /100 | #256 | Tragic $85,144 |
| Mexican American Indians | 0.5 /100 | #257 | Tragic $85,066 |
| Immigrants | Nicaragua | 0.5 /100 | #258 | Tragic $84,914 |
Demographics Similar to Samoans by Householder Income Ages 25 - 44 years
In terms of householder income ages 25 - 44 years, the demographic groups most similar to Samoans are Immigrants from the Azores ($92,322, a difference of 0.070%), Celtic ($92,241, a difference of 0.16%), Immigrants from Colombia ($92,204, a difference of 0.20%), Spanish ($92,200, a difference of 0.20%), and Vietnamese ($92,089, a difference of 0.32%).
| Demographics | Rating | Rank | Householder Income Ages 25 - 44 years |
| Sierra Leoneans | 34.8 /100 | #186 | Fair $93,435 |
| Spaniards | 34.0 /100 | #187 | Fair $93,366 |
| Immigrants | Sierra Leone | 30.9 /100 | #188 | Fair $93,115 |
| Dutch | 30.5 /100 | #189 | Fair $93,081 |
| Welsh | 30.0 /100 | #190 | Fair $93,039 |
| Tlingit-Haida | 29.4 /100 | #191 | Fair $92,987 |
| Immigrants | Costa Rica | 28.2 /100 | #192 | Fair $92,876 |
| Samoans | 23.0 /100 | #193 | Fair $92,385 |
| Immigrants | Azores | 22.4 /100 | #194 | Fair $92,322 |
| Celtics | 21.6 /100 | #195 | Fair $92,241 |
| Immigrants | Colombia | 21.3 /100 | #196 | Fair $92,204 |
| Spanish | 21.2 /100 | #197 | Fair $92,200 |
| Vietnamese | 20.2 /100 | #198 | Fair $92,089 |
| Kenyans | 16.8 /100 | #199 | Poor $91,684 |
| Whites/Caucasians | 16.7 /100 | #200 | Poor $91,668 |