Immigrants from Micronesia vs Immigrants from Nicaragua Householder Income Ages 25 - 44 years
COMPARE
Immigrants from Micronesia
Immigrants from Nicaragua
Householder Income Ages 25 - 44 years
Householder Income Ages 25 - 44 years Comparison
Immigrants from Micronesia
Immigrants from Nicaragua
$80,544
HOUSEHOLDER INCOME AGES 25 - 44 YEARS
0.0/ 100
METRIC RATING
301st/ 347
METRIC RANK
$84,914
HOUSEHOLDER INCOME AGES 25 - 44 YEARS
0.5/ 100
METRIC RATING
258th/ 347
METRIC RANK
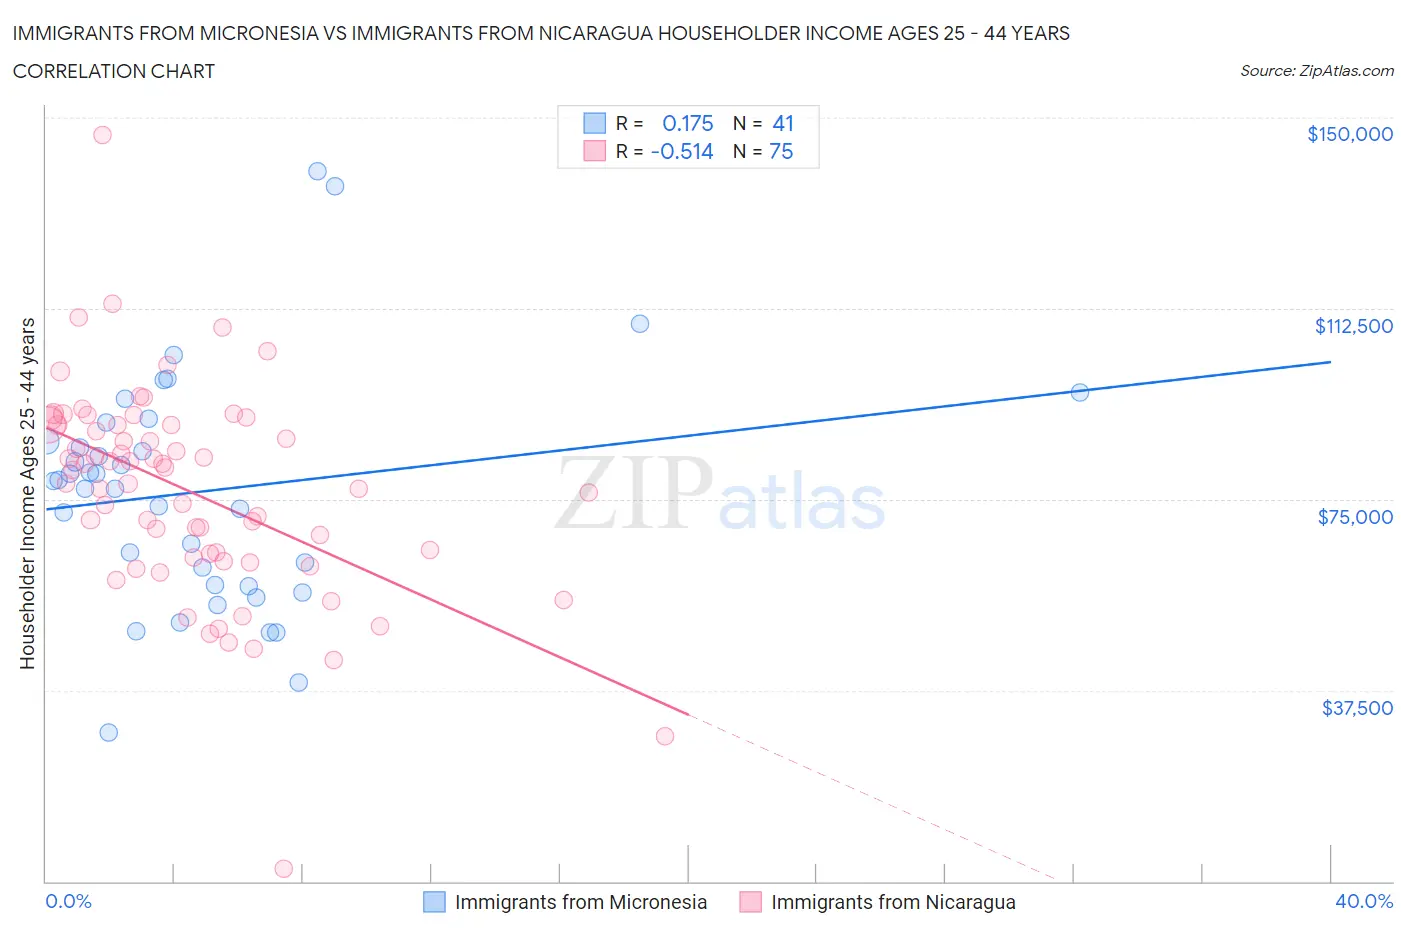
Immigrants from Micronesia vs Immigrants from Nicaragua Householder Income Ages 25 - 44 years Correlation Chart
The statistical analysis conducted on geographies consisting of 61,580,291 people shows a poor positive correlation between the proportion of Immigrants from Micronesia and household income with householder between the ages 25 and 44 in the United States with a correlation coefficient (R) of 0.175 and weighted average of $80,544. Similarly, the statistical analysis conducted on geographies consisting of 236,220,406 people shows a substantial negative correlation between the proportion of Immigrants from Nicaragua and household income with householder between the ages 25 and 44 in the United States with a correlation coefficient (R) of -0.514 and weighted average of $84,914, a difference of 5.4%.
Householder Income Ages 25 - 44 years Correlation Summary
| Measurement | Immigrants from Micronesia | Immigrants from Nicaragua |
| Minimum | $29,188 | $2,499 |
| Maximum | $139,375 | $146,625 |
| Range | $110,187 | $144,126 |
| Mean | $76,482 | $76,575 |
| Median | $78,666 | $80,789 |
| Interquartile 25% (IQ1) | $58,006 | $63,671 |
| Interquartile 75% (IQ3) | $88,259 | $89,720 |
| Interquartile Range (IQR) | $30,252 | $26,048 |
| Standard Deviation (Sample) | $22,989 | $20,803 |
| Standard Deviation (Population) | $22,707 | $20,664 |
Similar Demographics by Householder Income Ages 25 - 44 years
Demographics Similar to Immigrants from Micronesia by Householder Income Ages 25 - 44 years
In terms of householder income ages 25 - 44 years, the demographic groups most similar to Immigrants from Micronesia are Hispanic or Latino ($80,515, a difference of 0.040%), Mexican ($80,427, a difference of 0.14%), Immigrants from Caribbean ($80,326, a difference of 0.27%), Immigrants from Dominican Republic ($80,319, a difference of 0.28%), and Apache ($80,260, a difference of 0.35%).
| Demographics | Rating | Rank | Householder Income Ages 25 - 44 years |
| Cubans | 0.1 /100 | #294 | Tragic $81,483 |
| Bangladeshis | 0.1 /100 | #295 | Tragic $81,363 |
| Immigrants | Dominica | 0.1 /100 | #296 | Tragic $81,351 |
| Immigrants | Guatemala | 0.1 /100 | #297 | Tragic $81,341 |
| Dominicans | 0.1 /100 | #298 | Tragic $81,229 |
| Immigrants | Liberia | 0.1 /100 | #299 | Tragic $80,863 |
| Cherokee | 0.0 /100 | #300 | Tragic $80,843 |
| Immigrants | Micronesia | 0.0 /100 | #301 | Tragic $80,544 |
| Hispanics or Latinos | 0.0 /100 | #302 | Tragic $80,515 |
| Mexicans | 0.0 /100 | #303 | Tragic $80,427 |
| Immigrants | Caribbean | 0.0 /100 | #304 | Tragic $80,326 |
| Immigrants | Dominican Republic | 0.0 /100 | #305 | Tragic $80,319 |
| Apache | 0.0 /100 | #306 | Tragic $80,260 |
| Haitians | 0.0 /100 | #307 | Tragic $80,055 |
| Immigrants | Central America | 0.0 /100 | #308 | Tragic $80,012 |
Demographics Similar to Immigrants from Nicaragua by Householder Income Ages 25 - 44 years
In terms of householder income ages 25 - 44 years, the demographic groups most similar to Immigrants from Nicaragua are Immigrants from Senegal ($84,848, a difference of 0.080%), American ($84,791, a difference of 0.14%), Mexican American Indian ($85,066, a difference of 0.18%), Central American ($85,144, a difference of 0.27%), and Inupiat ($84,619, a difference of 0.35%).
| Demographics | Rating | Rank | Householder Income Ages 25 - 44 years |
| Cape Verdeans | 0.8 /100 | #251 | Tragic $85,758 |
| Immigrants | Western Africa | 0.7 /100 | #252 | Tragic $85,676 |
| British West Indians | 0.7 /100 | #253 | Tragic $85,565 |
| Immigrants | Laos | 0.7 /100 | #254 | Tragic $85,553 |
| German Russians | 0.6 /100 | #255 | Tragic $85,220 |
| Central Americans | 0.5 /100 | #256 | Tragic $85,144 |
| Mexican American Indians | 0.5 /100 | #257 | Tragic $85,066 |
| Immigrants | Nicaragua | 0.5 /100 | #258 | Tragic $84,914 |
| Immigrants | Senegal | 0.5 /100 | #259 | Tragic $84,848 |
| Americans | 0.4 /100 | #260 | Tragic $84,791 |
| Inupiat | 0.4 /100 | #261 | Tragic $84,619 |
| Cree | 0.4 /100 | #262 | Tragic $84,574 |
| Belizeans | 0.4 /100 | #263 | Tragic $84,534 |
| Osage | 0.4 /100 | #264 | Tragic $84,461 |
| Sudanese | 0.4 /100 | #265 | Tragic $84,401 |