Immigrants from Micronesia vs Immigrants from Lebanon Householder Income Ages 25 - 44 years
COMPARE
Immigrants from Micronesia
Immigrants from Lebanon
Householder Income Ages 25 - 44 years
Householder Income Ages 25 - 44 years Comparison
Immigrants from Micronesia
Immigrants from Lebanon
$80,544
HOUSEHOLDER INCOME AGES 25 - 44 YEARS
0.0/ 100
METRIC RATING
301st/ 347
METRIC RANK
$101,124
HOUSEHOLDER INCOME AGES 25 - 44 YEARS
97.4/ 100
METRIC RATING
102nd/ 347
METRIC RANK
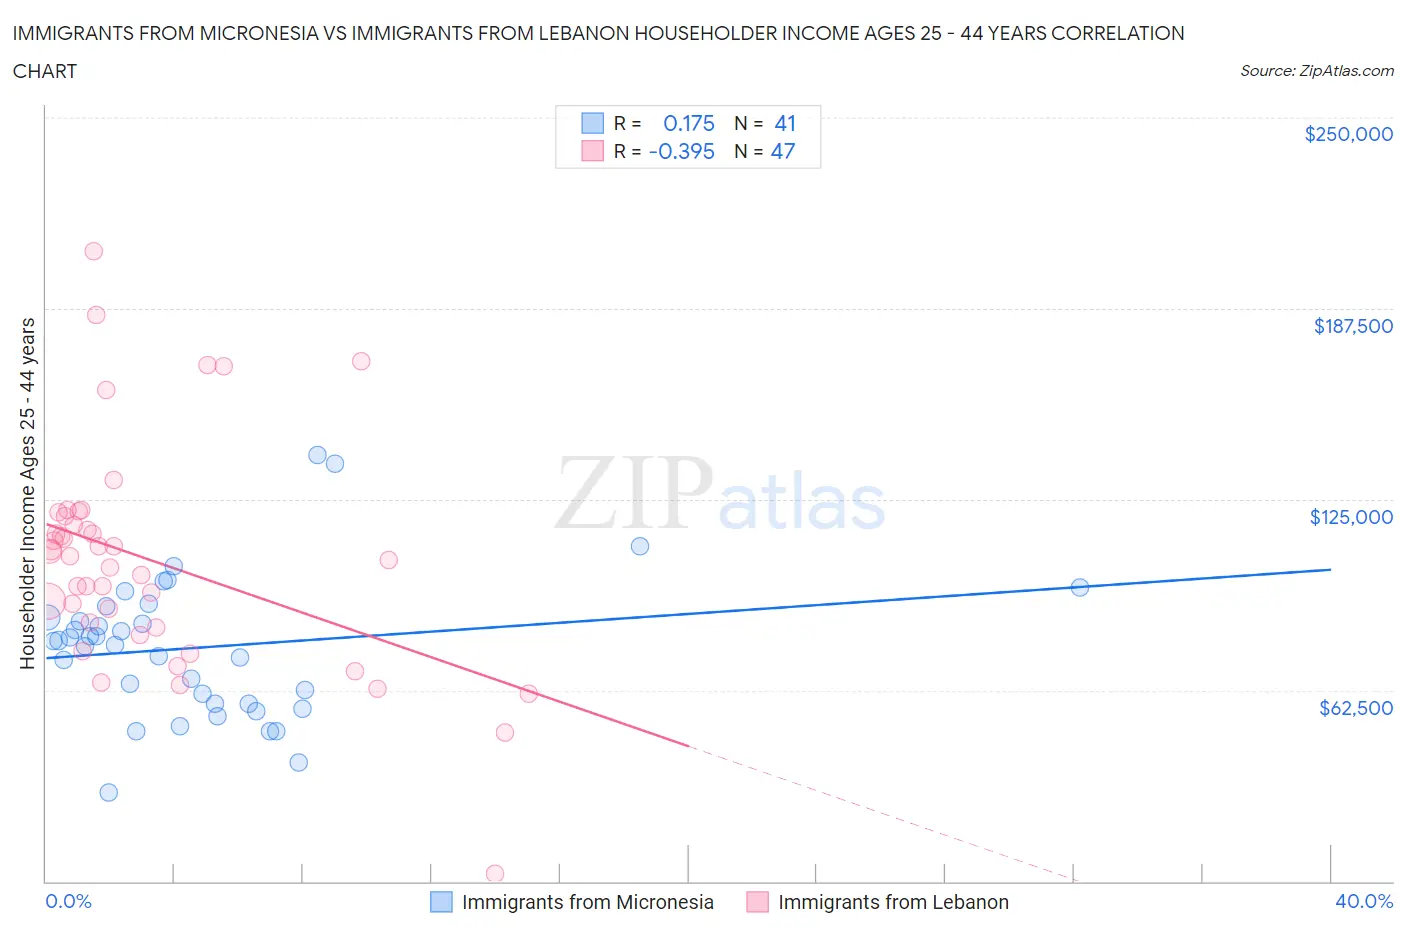
Immigrants from Micronesia vs Immigrants from Lebanon Householder Income Ages 25 - 44 years Correlation Chart
The statistical analysis conducted on geographies consisting of 61,580,291 people shows a poor positive correlation between the proportion of Immigrants from Micronesia and household income with householder between the ages 25 and 44 in the United States with a correlation coefficient (R) of 0.175 and weighted average of $80,544. Similarly, the statistical analysis conducted on geographies consisting of 217,010,857 people shows a mild negative correlation between the proportion of Immigrants from Lebanon and household income with householder between the ages 25 and 44 in the United States with a correlation coefficient (R) of -0.395 and weighted average of $101,124, a difference of 25.6%.
Householder Income Ages 25 - 44 years Correlation Summary
| Measurement | Immigrants from Micronesia | Immigrants from Lebanon |
| Minimum | $29,188 | $2,499 |
| Maximum | $139,375 | $206,381 |
| Range | $110,187 | $203,882 |
| Mean | $76,482 | $105,094 |
| Median | $78,666 | $106,198 |
| Interquartile 25% (IQ1) | $58,006 | $82,875 |
| Interquartile 75% (IQ3) | $88,259 | $119,653 |
| Interquartile Range (IQR) | $30,252 | $36,778 |
| Standard Deviation (Sample) | $22,989 | $36,794 |
| Standard Deviation (Population) | $22,707 | $36,401 |
Similar Demographics by Householder Income Ages 25 - 44 years
Demographics Similar to Immigrants from Micronesia by Householder Income Ages 25 - 44 years
In terms of householder income ages 25 - 44 years, the demographic groups most similar to Immigrants from Micronesia are Hispanic or Latino ($80,515, a difference of 0.040%), Mexican ($80,427, a difference of 0.14%), Immigrants from Caribbean ($80,326, a difference of 0.27%), Immigrants from Dominican Republic ($80,319, a difference of 0.28%), and Apache ($80,260, a difference of 0.35%).
| Demographics | Rating | Rank | Householder Income Ages 25 - 44 years |
| Cubans | 0.1 /100 | #294 | Tragic $81,483 |
| Bangladeshis | 0.1 /100 | #295 | Tragic $81,363 |
| Immigrants | Dominica | 0.1 /100 | #296 | Tragic $81,351 |
| Immigrants | Guatemala | 0.1 /100 | #297 | Tragic $81,341 |
| Dominicans | 0.1 /100 | #298 | Tragic $81,229 |
| Immigrants | Liberia | 0.1 /100 | #299 | Tragic $80,863 |
| Cherokee | 0.0 /100 | #300 | Tragic $80,843 |
| Immigrants | Micronesia | 0.0 /100 | #301 | Tragic $80,544 |
| Hispanics or Latinos | 0.0 /100 | #302 | Tragic $80,515 |
| Mexicans | 0.0 /100 | #303 | Tragic $80,427 |
| Immigrants | Caribbean | 0.0 /100 | #304 | Tragic $80,326 |
| Immigrants | Dominican Republic | 0.0 /100 | #305 | Tragic $80,319 |
| Apache | 0.0 /100 | #306 | Tragic $80,260 |
| Haitians | 0.0 /100 | #307 | Tragic $80,055 |
| Immigrants | Central America | 0.0 /100 | #308 | Tragic $80,012 |
Demographics Similar to Immigrants from Lebanon by Householder Income Ages 25 - 44 years
In terms of householder income ages 25 - 44 years, the demographic groups most similar to Immigrants from Lebanon are Immigrants from Moldova ($101,091, a difference of 0.030%), Immigrants from Poland ($101,065, a difference of 0.060%), Albanian ($101,367, a difference of 0.24%), Immigrants from Argentina ($101,415, a difference of 0.29%), and Taiwanese ($101,492, a difference of 0.36%).
| Demographics | Rating | Rank | Householder Income Ages 25 - 44 years |
| Assyrians/Chaldeans/Syriacs | 98.3 /100 | #95 | Exceptional $101,936 |
| Macedonians | 98.3 /100 | #96 | Exceptional $101,882 |
| Austrians | 98.3 /100 | #97 | Exceptional $101,842 |
| Immigrants | Kazakhstan | 98.1 /100 | #98 | Exceptional $101,727 |
| Taiwanese | 97.9 /100 | #99 | Exceptional $101,492 |
| Immigrants | Argentina | 97.8 /100 | #100 | Exceptional $101,415 |
| Albanians | 97.8 /100 | #101 | Exceptional $101,367 |
| Immigrants | Lebanon | 97.4 /100 | #102 | Exceptional $101,124 |
| Immigrants | Moldova | 97.4 /100 | #103 | Exceptional $101,091 |
| Immigrants | Poland | 97.4 /100 | #104 | Exceptional $101,065 |
| Immigrants | Vietnam | 96.5 /100 | #105 | Exceptional $100,535 |
| Immigrants | Brazil | 96.5 /100 | #106 | Exceptional $100,534 |
| Northern Europeans | 96.3 /100 | #107 | Exceptional $100,457 |
| Immigrants | South Eastern Asia | 96.0 /100 | #108 | Exceptional $100,283 |
| Immigrants | North Macedonia | 95.6 /100 | #109 | Exceptional $100,101 |