Marshallese vs Immigrants from Lebanon Householder Income Ages 25 - 44 years
COMPARE
Marshallese
Immigrants from Lebanon
Householder Income Ages 25 - 44 years
Householder Income Ages 25 - 44 years Comparison
Marshallese
Immigrants from Lebanon
$83,575
HOUSEHOLDER INCOME AGES 25 - 44 YEARS
0.2/ 100
METRIC RATING
274th/ 347
METRIC RANK
$101,124
HOUSEHOLDER INCOME AGES 25 - 44 YEARS
97.4/ 100
METRIC RATING
102nd/ 347
METRIC RANK
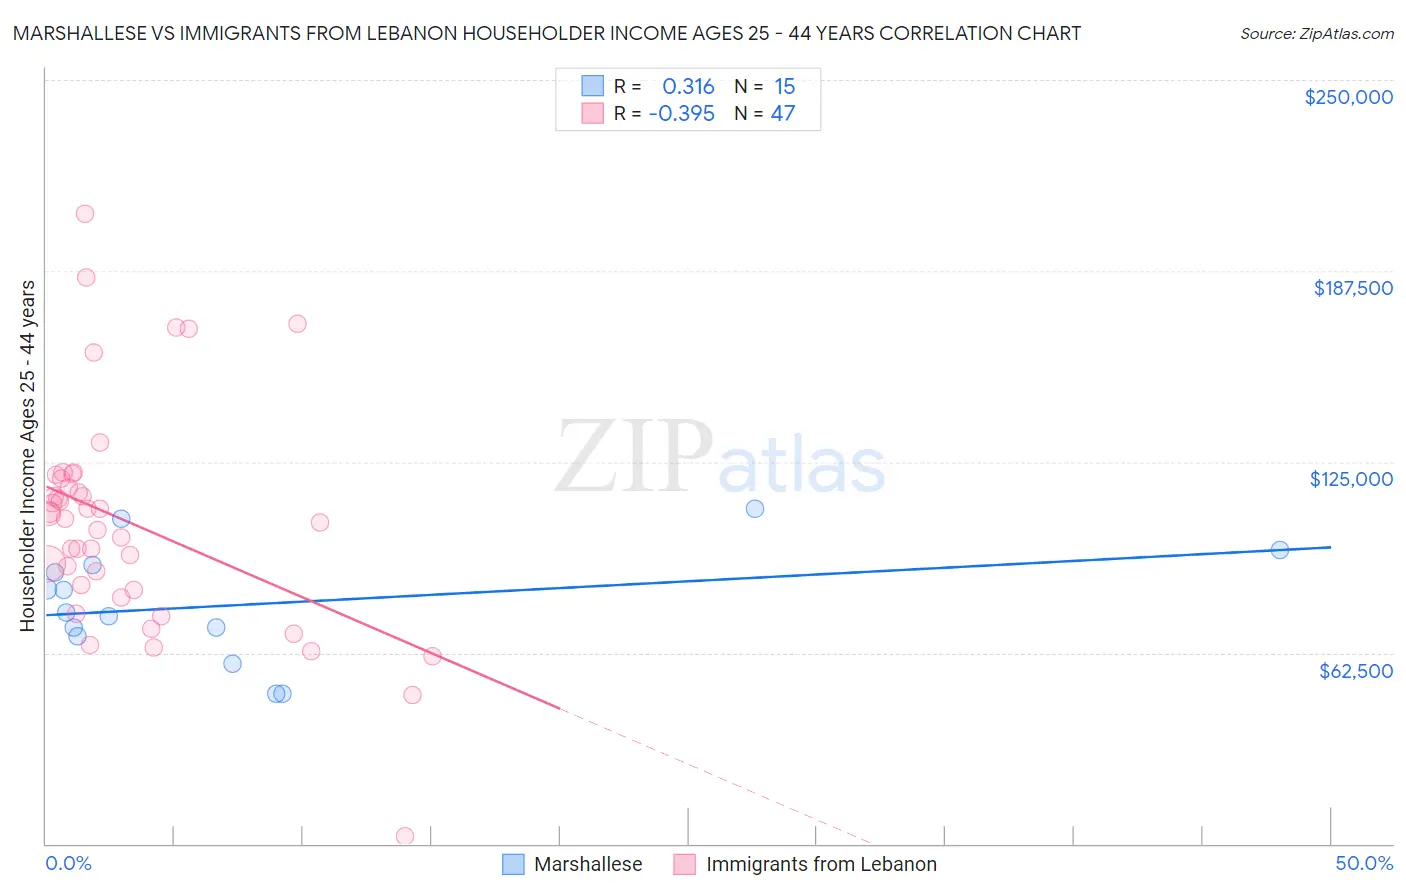
Marshallese vs Immigrants from Lebanon Householder Income Ages 25 - 44 years Correlation Chart
The statistical analysis conducted on geographies consisting of 14,753,881 people shows a mild positive correlation between the proportion of Marshallese and household income with householder between the ages 25 and 44 in the United States with a correlation coefficient (R) of 0.316 and weighted average of $83,575. Similarly, the statistical analysis conducted on geographies consisting of 217,010,857 people shows a mild negative correlation between the proportion of Immigrants from Lebanon and household income with householder between the ages 25 and 44 in the United States with a correlation coefficient (R) of -0.395 and weighted average of $101,124, a difference of 21.0%.
Householder Income Ages 25 - 44 years Correlation Summary
| Measurement | Marshallese | Immigrants from Lebanon |
| Minimum | $48,906 | $2,499 |
| Maximum | $109,583 | $206,381 |
| Range | $60,677 | $203,882 |
| Mean | $78,342 | $105,094 |
| Median | $75,712 | $106,198 |
| Interquartile 25% (IQ1) | $67,813 | $82,875 |
| Interquartile 75% (IQ3) | $91,124 | $119,653 |
| Interquartile Range (IQR) | $23,311 | $36,778 |
| Standard Deviation (Sample) | $18,418 | $36,794 |
| Standard Deviation (Population) | $17,794 | $36,401 |
Similar Demographics by Householder Income Ages 25 - 44 years
Demographics Similar to Marshallese by Householder Income Ages 25 - 44 years
In terms of householder income ages 25 - 44 years, the demographic groups most similar to Marshallese are Iroquois ($83,682, a difference of 0.13%), Spanish American ($83,722, a difference of 0.18%), Somali ($83,752, a difference of 0.21%), Immigrants from Jamaica ($83,298, a difference of 0.33%), and Jamaican ($83,933, a difference of 0.43%).
| Demographics | Rating | Rank | Householder Income Ages 25 - 44 years |
| Hmong | 0.3 /100 | #267 | Tragic $84,258 |
| Sub-Saharan Africans | 0.3 /100 | #268 | Tragic $84,235 |
| Spanish American Indians | 0.3 /100 | #269 | Tragic $84,085 |
| Jamaicans | 0.3 /100 | #270 | Tragic $83,933 |
| Somalis | 0.2 /100 | #271 | Tragic $83,752 |
| Spanish Americans | 0.2 /100 | #272 | Tragic $83,722 |
| Iroquois | 0.2 /100 | #273 | Tragic $83,682 |
| Marshallese | 0.2 /100 | #274 | Tragic $83,575 |
| Immigrants | Jamaica | 0.2 /100 | #275 | Tragic $83,298 |
| Immigrants | Belize | 0.2 /100 | #276 | Tragic $83,141 |
| Paiute | 0.2 /100 | #277 | Tragic $82,984 |
| Senegalese | 0.2 /100 | #278 | Tragic $82,852 |
| Pima | 0.1 /100 | #279 | Tragic $82,821 |
| Colville | 0.1 /100 | #280 | Tragic $82,604 |
| Cajuns | 0.1 /100 | #281 | Tragic $82,393 |
Demographics Similar to Immigrants from Lebanon by Householder Income Ages 25 - 44 years
In terms of householder income ages 25 - 44 years, the demographic groups most similar to Immigrants from Lebanon are Immigrants from Moldova ($101,091, a difference of 0.030%), Immigrants from Poland ($101,065, a difference of 0.060%), Albanian ($101,367, a difference of 0.24%), Immigrants from Argentina ($101,415, a difference of 0.29%), and Taiwanese ($101,492, a difference of 0.36%).
| Demographics | Rating | Rank | Householder Income Ages 25 - 44 years |
| Assyrians/Chaldeans/Syriacs | 98.3 /100 | #95 | Exceptional $101,936 |
| Macedonians | 98.3 /100 | #96 | Exceptional $101,882 |
| Austrians | 98.3 /100 | #97 | Exceptional $101,842 |
| Immigrants | Kazakhstan | 98.1 /100 | #98 | Exceptional $101,727 |
| Taiwanese | 97.9 /100 | #99 | Exceptional $101,492 |
| Immigrants | Argentina | 97.8 /100 | #100 | Exceptional $101,415 |
| Albanians | 97.8 /100 | #101 | Exceptional $101,367 |
| Immigrants | Lebanon | 97.4 /100 | #102 | Exceptional $101,124 |
| Immigrants | Moldova | 97.4 /100 | #103 | Exceptional $101,091 |
| Immigrants | Poland | 97.4 /100 | #104 | Exceptional $101,065 |
| Immigrants | Vietnam | 96.5 /100 | #105 | Exceptional $100,535 |
| Immigrants | Brazil | 96.5 /100 | #106 | Exceptional $100,534 |
| Northern Europeans | 96.3 /100 | #107 | Exceptional $100,457 |
| Immigrants | South Eastern Asia | 96.0 /100 | #108 | Exceptional $100,283 |
| Immigrants | North Macedonia | 95.6 /100 | #109 | Exceptional $100,101 |