Alaska Native vs Immigrants from Lebanon Householder Income Ages 25 - 44 years
COMPARE
Alaska Native
Immigrants from Lebanon
Householder Income Ages 25 - 44 years
Householder Income Ages 25 - 44 years Comparison
Alaska Natives
Immigrants from Lebanon
$88,018
HOUSEHOLDER INCOME AGES 25 - 44 YEARS
2.6/ 100
METRIC RATING
238th/ 347
METRIC RANK
$101,124
HOUSEHOLDER INCOME AGES 25 - 44 YEARS
97.4/ 100
METRIC RATING
102nd/ 347
METRIC RANK
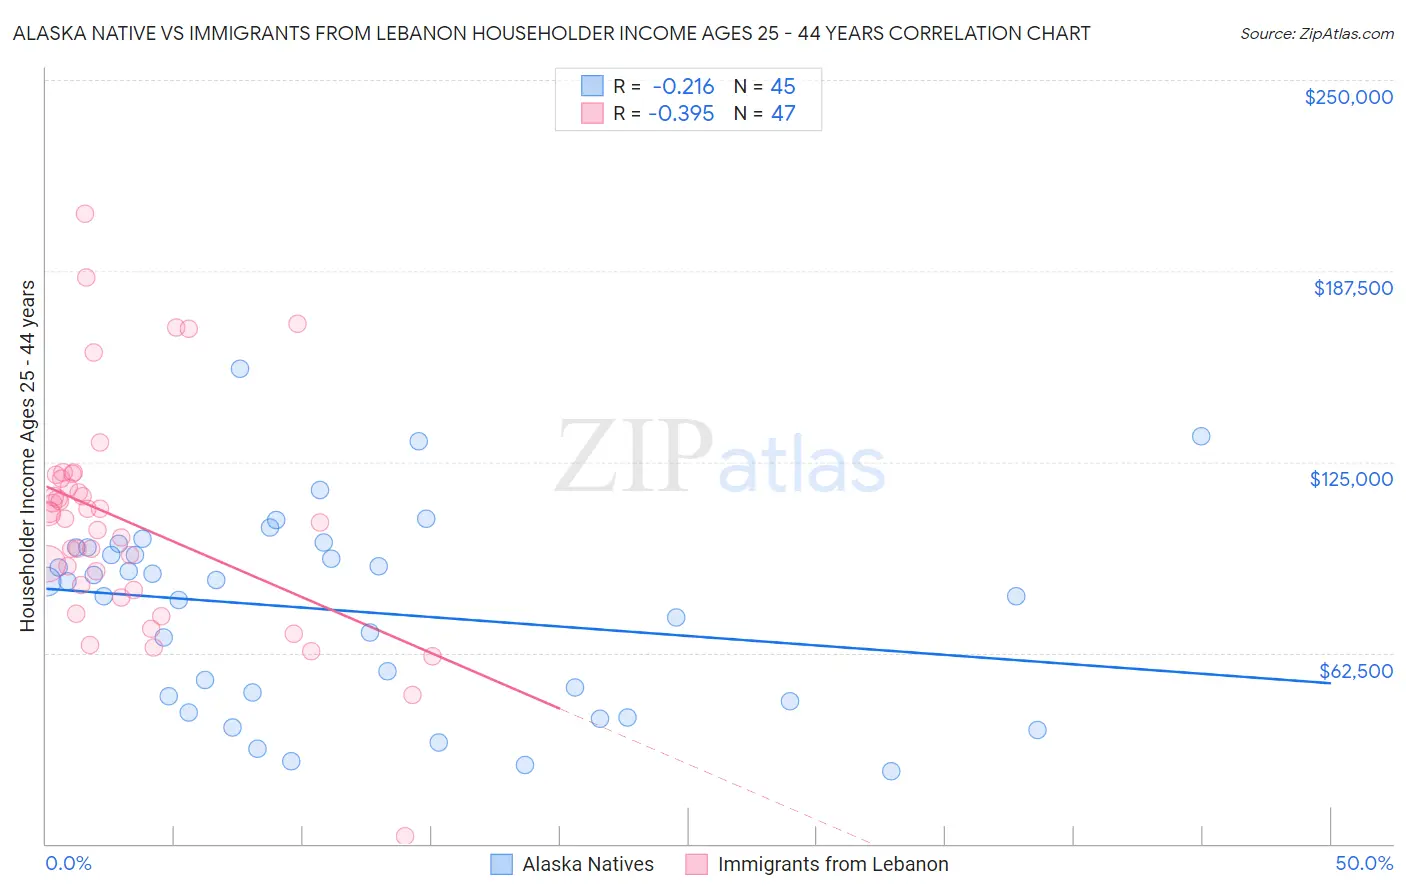
Alaska Native vs Immigrants from Lebanon Householder Income Ages 25 - 44 years Correlation Chart
The statistical analysis conducted on geographies consisting of 76,687,896 people shows a weak negative correlation between the proportion of Alaska Natives and household income with householder between the ages 25 and 44 in the United States with a correlation coefficient (R) of -0.216 and weighted average of $88,018. Similarly, the statistical analysis conducted on geographies consisting of 217,010,857 people shows a mild negative correlation between the proportion of Immigrants from Lebanon and household income with householder between the ages 25 and 44 in the United States with a correlation coefficient (R) of -0.395 and weighted average of $101,124, a difference of 14.9%.
Householder Income Ages 25 - 44 years Correlation Summary
| Measurement | Alaska Native | Immigrants from Lebanon |
| Minimum | $23,750 | $2,499 |
| Maximum | $155,658 | $206,381 |
| Range | $131,908 | $203,882 |
| Mean | $76,232 | $105,094 |
| Median | $85,753 | $106,198 |
| Interquartile 25% (IQ1) | $47,396 | $82,875 |
| Interquartile 75% (IQ3) | $96,980 | $119,653 |
| Interquartile Range (IQR) | $49,584 | $36,778 |
| Standard Deviation (Sample) | $31,478 | $36,794 |
| Standard Deviation (Population) | $31,126 | $36,401 |
Similar Demographics by Householder Income Ages 25 - 44 years
Demographics Similar to Alaska Natives by Householder Income Ages 25 - 44 years
In terms of householder income ages 25 - 44 years, the demographic groups most similar to Alaska Natives are Salvadoran ($88,198, a difference of 0.20%), Immigrants from Cameroon ($88,214, a difference of 0.22%), Venezuelan ($88,232, a difference of 0.24%), Bermudan ($88,231, a difference of 0.24%), and Immigrants from Ghana ($87,760, a difference of 0.29%).
| Demographics | Rating | Rank | Householder Income Ages 25 - 44 years |
| Immigrants | Grenada | 3.0 /100 | #231 | Tragic $88,311 |
| Immigrants | Nonimmigrants | 3.0 /100 | #232 | Tragic $88,301 |
| Malaysians | 3.0 /100 | #233 | Tragic $88,291 |
| Venezuelans | 2.9 /100 | #234 | Tragic $88,232 |
| Bermudans | 2.9 /100 | #235 | Tragic $88,231 |
| Immigrants | Cameroon | 2.9 /100 | #236 | Tragic $88,214 |
| Salvadorans | 2.8 /100 | #237 | Tragic $88,198 |
| Alaska Natives | 2.6 /100 | #238 | Tragic $88,018 |
| Immigrants | Ghana | 2.2 /100 | #239 | Tragic $87,760 |
| Nicaraguans | 2.2 /100 | #240 | Tragic $87,751 |
| Nigerians | 2.2 /100 | #241 | Tragic $87,730 |
| West Indians | 1.7 /100 | #242 | Tragic $87,205 |
| Immigrants | West Indies | 1.5 /100 | #243 | Tragic $87,063 |
| Immigrants | Venezuela | 1.5 /100 | #244 | Tragic $87,038 |
| Immigrants | El Salvador | 1.4 /100 | #245 | Tragic $86,913 |
Demographics Similar to Immigrants from Lebanon by Householder Income Ages 25 - 44 years
In terms of householder income ages 25 - 44 years, the demographic groups most similar to Immigrants from Lebanon are Immigrants from Moldova ($101,091, a difference of 0.030%), Immigrants from Poland ($101,065, a difference of 0.060%), Albanian ($101,367, a difference of 0.24%), Immigrants from Argentina ($101,415, a difference of 0.29%), and Taiwanese ($101,492, a difference of 0.36%).
| Demographics | Rating | Rank | Householder Income Ages 25 - 44 years |
| Assyrians/Chaldeans/Syriacs | 98.3 /100 | #95 | Exceptional $101,936 |
| Macedonians | 98.3 /100 | #96 | Exceptional $101,882 |
| Austrians | 98.3 /100 | #97 | Exceptional $101,842 |
| Immigrants | Kazakhstan | 98.1 /100 | #98 | Exceptional $101,727 |
| Taiwanese | 97.9 /100 | #99 | Exceptional $101,492 |
| Immigrants | Argentina | 97.8 /100 | #100 | Exceptional $101,415 |
| Albanians | 97.8 /100 | #101 | Exceptional $101,367 |
| Immigrants | Lebanon | 97.4 /100 | #102 | Exceptional $101,124 |
| Immigrants | Moldova | 97.4 /100 | #103 | Exceptional $101,091 |
| Immigrants | Poland | 97.4 /100 | #104 | Exceptional $101,065 |
| Immigrants | Vietnam | 96.5 /100 | #105 | Exceptional $100,535 |
| Immigrants | Brazil | 96.5 /100 | #106 | Exceptional $100,534 |
| Northern Europeans | 96.3 /100 | #107 | Exceptional $100,457 |
| Immigrants | South Eastern Asia | 96.0 /100 | #108 | Exceptional $100,283 |
| Immigrants | North Macedonia | 95.6 /100 | #109 | Exceptional $100,101 |