Immigrants from Cuba vs Jamaican Householder Income Ages 45 - 64 years
COMPARE
Immigrants from Cuba
Jamaican
Householder Income Ages 45 - 64 years
Householder Income Ages 45 - 64 years Comparison
Immigrants from Cuba
Jamaicans
$80,662
HOUSEHOLDER INCOME AGES 45 - 64 YEARS
0.0/ 100
METRIC RATING
325th/ 347
METRIC RANK
$88,327
HOUSEHOLDER INCOME AGES 45 - 64 YEARS
0.2/ 100
METRIC RATING
265th/ 347
METRIC RANK
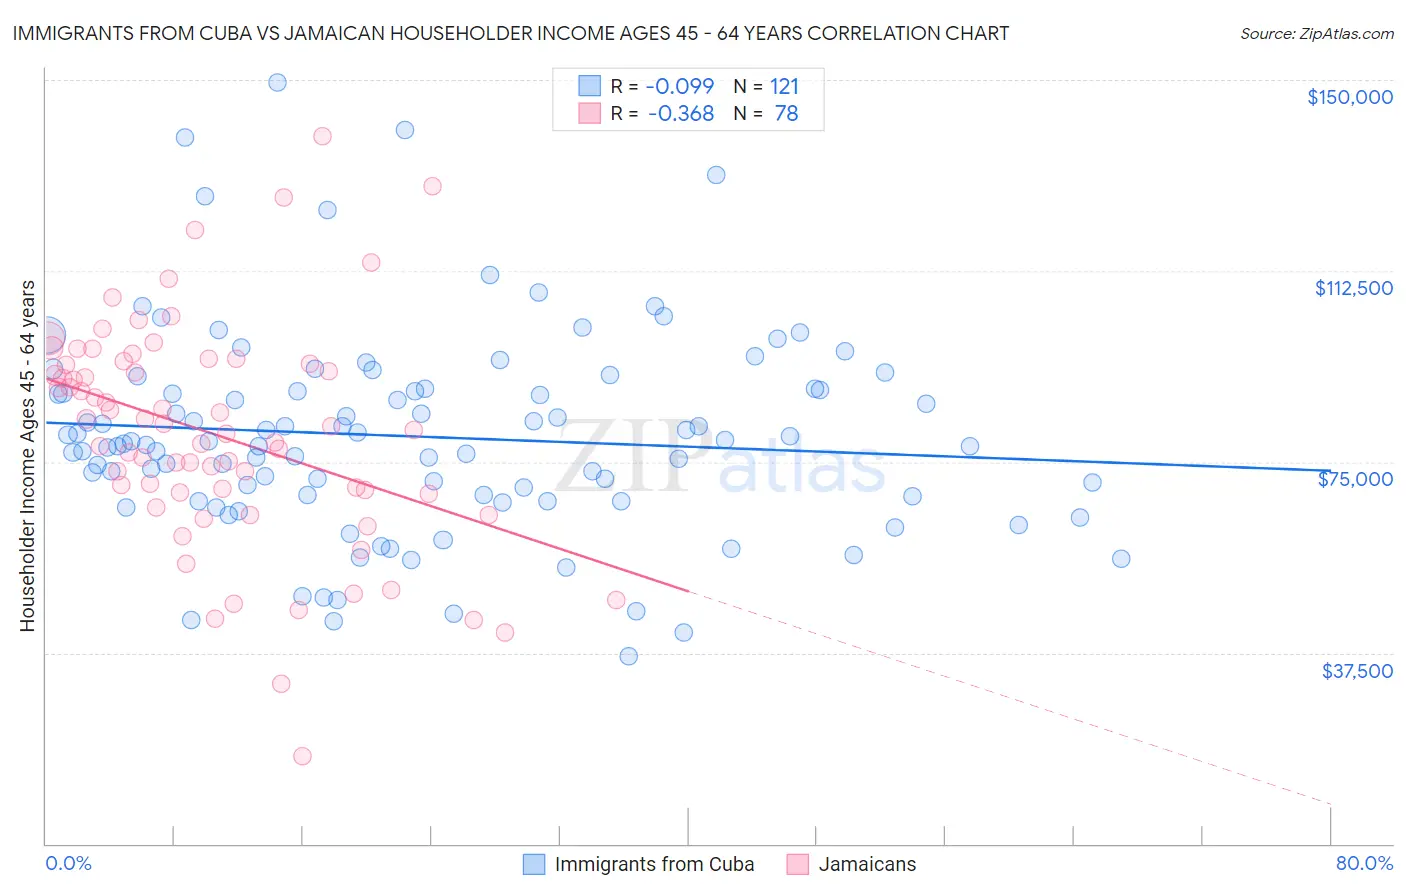
Immigrants from Cuba vs Jamaican Householder Income Ages 45 - 64 years Correlation Chart
The statistical analysis conducted on geographies consisting of 325,648,995 people shows a slight negative correlation between the proportion of Immigrants from Cuba and household income with householder between the ages 45 and 64 in the United States with a correlation coefficient (R) of -0.099 and weighted average of $80,662. Similarly, the statistical analysis conducted on geographies consisting of 367,130,197 people shows a mild negative correlation between the proportion of Jamaicans and household income with householder between the ages 45 and 64 in the United States with a correlation coefficient (R) of -0.368 and weighted average of $88,327, a difference of 9.5%.
Householder Income Ages 45 - 64 years Correlation Summary
| Measurement | Immigrants from Cuba | Jamaican |
| Minimum | $36,806 | $17,167 |
| Maximum | $149,489 | $139,000 |
| Range | $112,683 | $121,833 |
| Mean | $79,969 | $80,364 |
| Median | $78,597 | $81,673 |
| Interquartile 25% (IQ1) | $67,753 | $68,925 |
| Interquartile 75% (IQ3) | $89,231 | $94,316 |
| Interquartile Range (IQR) | $21,478 | $25,392 |
| Standard Deviation (Sample) | $20,104 | $22,119 |
| Standard Deviation (Population) | $20,021 | $21,977 |
Similar Demographics by Householder Income Ages 45 - 64 years
Demographics Similar to Immigrants from Cuba by Householder Income Ages 45 - 64 years
In terms of householder income ages 45 - 64 years, the demographic groups most similar to Immigrants from Cuba are Dominican ($80,623, a difference of 0.050%), Yup'ik ($81,000, a difference of 0.42%), Seminole ($80,077, a difference of 0.73%), Bahamian ($81,369, a difference of 0.88%), and Native/Alaskan ($79,816, a difference of 1.1%).
| Demographics | Rating | Rank | Householder Income Ages 45 - 64 years |
| Choctaw | 0.0 /100 | #318 | Tragic $82,287 |
| Chickasaw | 0.0 /100 | #319 | Tragic $82,193 |
| Apache | 0.0 /100 | #320 | Tragic $82,184 |
| Yuman | 0.0 /100 | #321 | Tragic $82,139 |
| Sioux | 0.0 /100 | #322 | Tragic $81,750 |
| Bahamians | 0.0 /100 | #323 | Tragic $81,369 |
| Yup'ik | 0.0 /100 | #324 | Tragic $81,000 |
| Immigrants | Cuba | 0.0 /100 | #325 | Tragic $80,662 |
| Dominicans | 0.0 /100 | #326 | Tragic $80,623 |
| Seminole | 0.0 /100 | #327 | Tragic $80,077 |
| Natives/Alaskans | 0.0 /100 | #328 | Tragic $79,816 |
| Dutch West Indians | 0.0 /100 | #329 | Tragic $79,171 |
| Creek | 0.0 /100 | #330 | Tragic $78,960 |
| Immigrants | Dominican Republic | 0.0 /100 | #331 | Tragic $78,836 |
| Blacks/African Americans | 0.0 /100 | #332 | Tragic $78,556 |
Demographics Similar to Jamaicans by Householder Income Ages 45 - 64 years
In terms of householder income ages 45 - 64 years, the demographic groups most similar to Jamaicans are Osage ($88,390, a difference of 0.070%), Immigrants from Senegal ($88,421, a difference of 0.11%), Immigrants from West Indies ($88,164, a difference of 0.19%), Hmong ($88,115, a difference of 0.24%), and Somali ($88,600, a difference of 0.31%).
| Demographics | Rating | Rank | Householder Income Ages 45 - 64 years |
| Immigrants | Barbados | 0.4 /100 | #258 | Tragic $89,394 |
| Immigrants | Nicaragua | 0.4 /100 | #259 | Tragic $89,108 |
| Liberians | 0.3 /100 | #260 | Tragic $88,929 |
| Belizeans | 0.3 /100 | #261 | Tragic $88,684 |
| Somalis | 0.3 /100 | #262 | Tragic $88,600 |
| Immigrants | Senegal | 0.3 /100 | #263 | Tragic $88,421 |
| Osage | 0.3 /100 | #264 | Tragic $88,390 |
| Jamaicans | 0.2 /100 | #265 | Tragic $88,327 |
| Immigrants | West Indies | 0.2 /100 | #266 | Tragic $88,164 |
| Hmong | 0.2 /100 | #267 | Tragic $88,115 |
| Immigrants | Micronesia | 0.2 /100 | #268 | Tragic $87,864 |
| Spanish Americans | 0.2 /100 | #269 | Tragic $87,836 |
| Immigrants | Liberia | 0.2 /100 | #270 | Tragic $87,739 |
| Guatemalans | 0.2 /100 | #271 | Tragic $87,705 |
| Cape Verdeans | 0.2 /100 | #272 | Tragic $87,580 |