Navajo vs Jamaican Householder Income Ages 45 - 64 years
COMPARE
Navajo
Jamaican
Householder Income Ages 45 - 64 years
Householder Income Ages 45 - 64 years Comparison
Navajo
Jamaicans
$69,759
HOUSEHOLDER INCOME AGES 45 - 64 YEARS
0.0/ 100
METRIC RATING
345th/ 347
METRIC RANK
$88,327
HOUSEHOLDER INCOME AGES 45 - 64 YEARS
0.2/ 100
METRIC RATING
265th/ 347
METRIC RANK
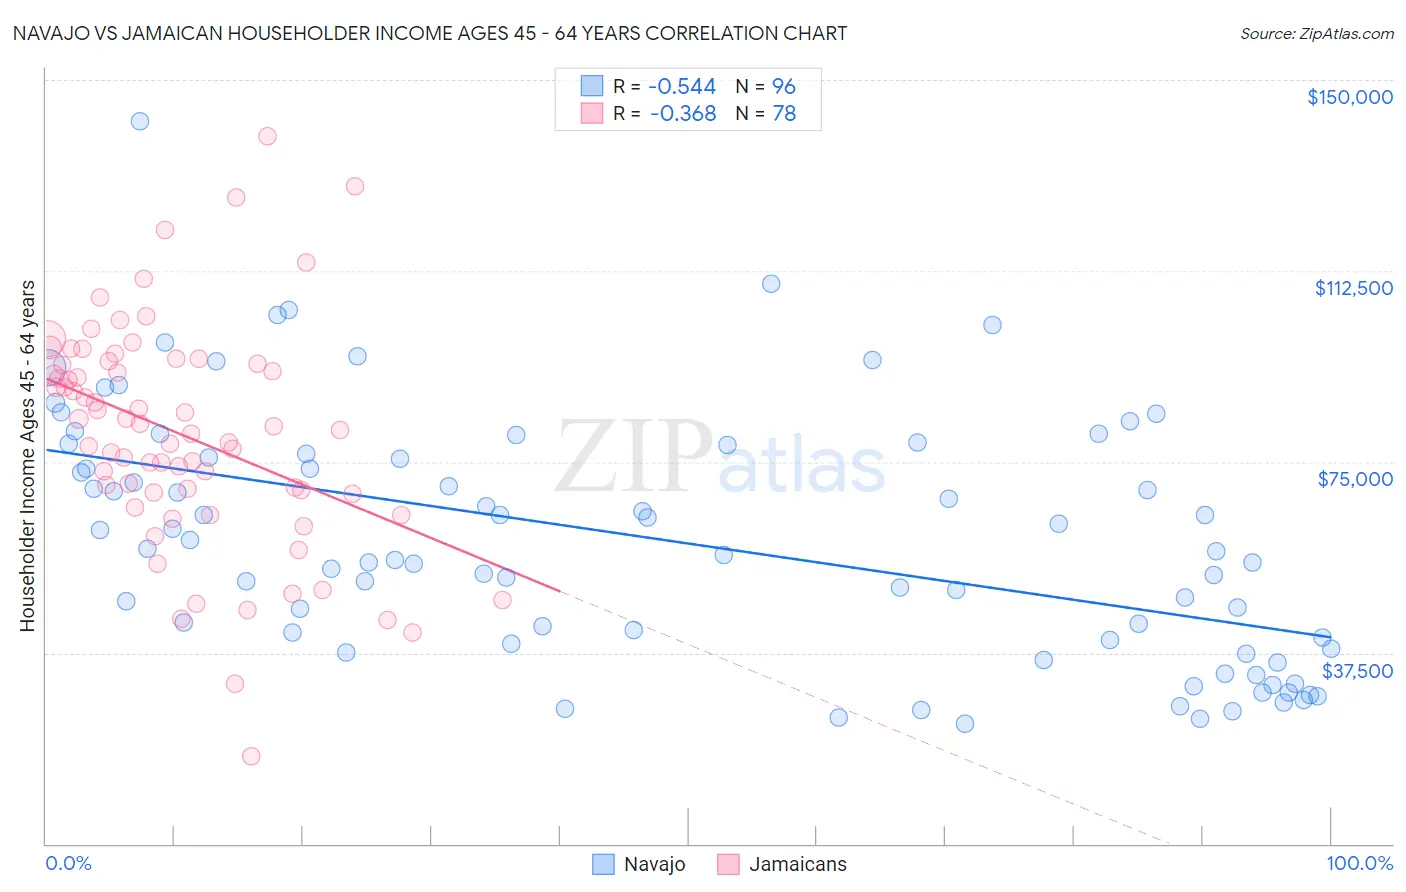
Navajo vs Jamaican Householder Income Ages 45 - 64 years Correlation Chart
The statistical analysis conducted on geographies consisting of 224,499,663 people shows a substantial negative correlation between the proportion of Navajo and household income with householder between the ages 45 and 64 in the United States with a correlation coefficient (R) of -0.544 and weighted average of $69,759. Similarly, the statistical analysis conducted on geographies consisting of 367,130,197 people shows a mild negative correlation between the proportion of Jamaicans and household income with householder between the ages 45 and 64 in the United States with a correlation coefficient (R) of -0.368 and weighted average of $88,327, a difference of 26.6%.
Householder Income Ages 45 - 64 years Correlation Summary
| Measurement | Navajo | Jamaican |
| Minimum | $23,688 | $17,167 |
| Maximum | $142,006 | $139,000 |
| Range | $118,318 | $121,833 |
| Mean | $59,518 | $80,364 |
| Median | $57,088 | $81,673 |
| Interquartile 25% (IQ1) | $39,664 | $68,925 |
| Interquartile 75% (IQ3) | $76,283 | $94,316 |
| Interquartile Range (IQR) | $36,618 | $25,392 |
| Standard Deviation (Sample) | $24,055 | $22,119 |
| Standard Deviation (Population) | $23,929 | $21,977 |
Similar Demographics by Householder Income Ages 45 - 64 years
Demographics Similar to Navajo by Householder Income Ages 45 - 64 years
In terms of householder income ages 45 - 64 years, the demographic groups most similar to Navajo are Puerto Rican ($69,234, a difference of 0.76%), Houma ($72,093, a difference of 3.4%), Pima ($73,365, a difference of 5.2%), Tohono O'odham ($73,774, a difference of 5.8%), and Crow ($74,257, a difference of 6.5%).
| Demographics | Rating | Rank | Householder Income Ages 45 - 64 years |
| Immigrants | Congo | 0.0 /100 | #333 | Tragic $77,850 |
| Menominee | 0.0 /100 | #334 | Tragic $76,903 |
| Cheyenne | 0.0 /100 | #335 | Tragic $76,362 |
| Arapaho | 0.0 /100 | #336 | Tragic $75,945 |
| Pueblo | 0.0 /100 | #337 | Tragic $75,601 |
| Hopi | 0.0 /100 | #338 | Tragic $75,562 |
| Kiowa | 0.0 /100 | #339 | Tragic $74,815 |
| Immigrants | Yemen | 0.0 /100 | #340 | Tragic $74,575 |
| Crow | 0.0 /100 | #341 | Tragic $74,257 |
| Tohono O'odham | 0.0 /100 | #342 | Tragic $73,774 |
| Pima | 0.0 /100 | #343 | Tragic $73,365 |
| Houma | 0.0 /100 | #344 | Tragic $72,093 |
| Navajo | 0.0 /100 | #345 | Tragic $69,759 |
| Puerto Ricans | 0.0 /100 | #346 | Tragic $69,234 |
| Lumbee | 0.0 /100 | #347 | Tragic $65,113 |
Demographics Similar to Jamaicans by Householder Income Ages 45 - 64 years
In terms of householder income ages 45 - 64 years, the demographic groups most similar to Jamaicans are Osage ($88,390, a difference of 0.070%), Immigrants from Senegal ($88,421, a difference of 0.11%), Immigrants from West Indies ($88,164, a difference of 0.19%), Hmong ($88,115, a difference of 0.24%), and Somali ($88,600, a difference of 0.31%).
| Demographics | Rating | Rank | Householder Income Ages 45 - 64 years |
| Immigrants | Barbados | 0.4 /100 | #258 | Tragic $89,394 |
| Immigrants | Nicaragua | 0.4 /100 | #259 | Tragic $89,108 |
| Liberians | 0.3 /100 | #260 | Tragic $88,929 |
| Belizeans | 0.3 /100 | #261 | Tragic $88,684 |
| Somalis | 0.3 /100 | #262 | Tragic $88,600 |
| Immigrants | Senegal | 0.3 /100 | #263 | Tragic $88,421 |
| Osage | 0.3 /100 | #264 | Tragic $88,390 |
| Jamaicans | 0.2 /100 | #265 | Tragic $88,327 |
| Immigrants | West Indies | 0.2 /100 | #266 | Tragic $88,164 |
| Hmong | 0.2 /100 | #267 | Tragic $88,115 |
| Immigrants | Micronesia | 0.2 /100 | #268 | Tragic $87,864 |
| Spanish Americans | 0.2 /100 | #269 | Tragic $87,836 |
| Immigrants | Liberia | 0.2 /100 | #270 | Tragic $87,739 |
| Guatemalans | 0.2 /100 | #271 | Tragic $87,705 |
| Cape Verdeans | 0.2 /100 | #272 | Tragic $87,580 |