Guyanese vs Jamaican Householder Income Ages 45 - 64 years
COMPARE
Guyanese
Jamaican
Householder Income Ages 45 - 64 years
Householder Income Ages 45 - 64 years Comparison
Guyanese
Jamaicans
$90,966
HOUSEHOLDER INCOME AGES 45 - 64 YEARS
0.9/ 100
METRIC RATING
245th/ 347
METRIC RANK
$88,327
HOUSEHOLDER INCOME AGES 45 - 64 YEARS
0.2/ 100
METRIC RATING
265th/ 347
METRIC RANK
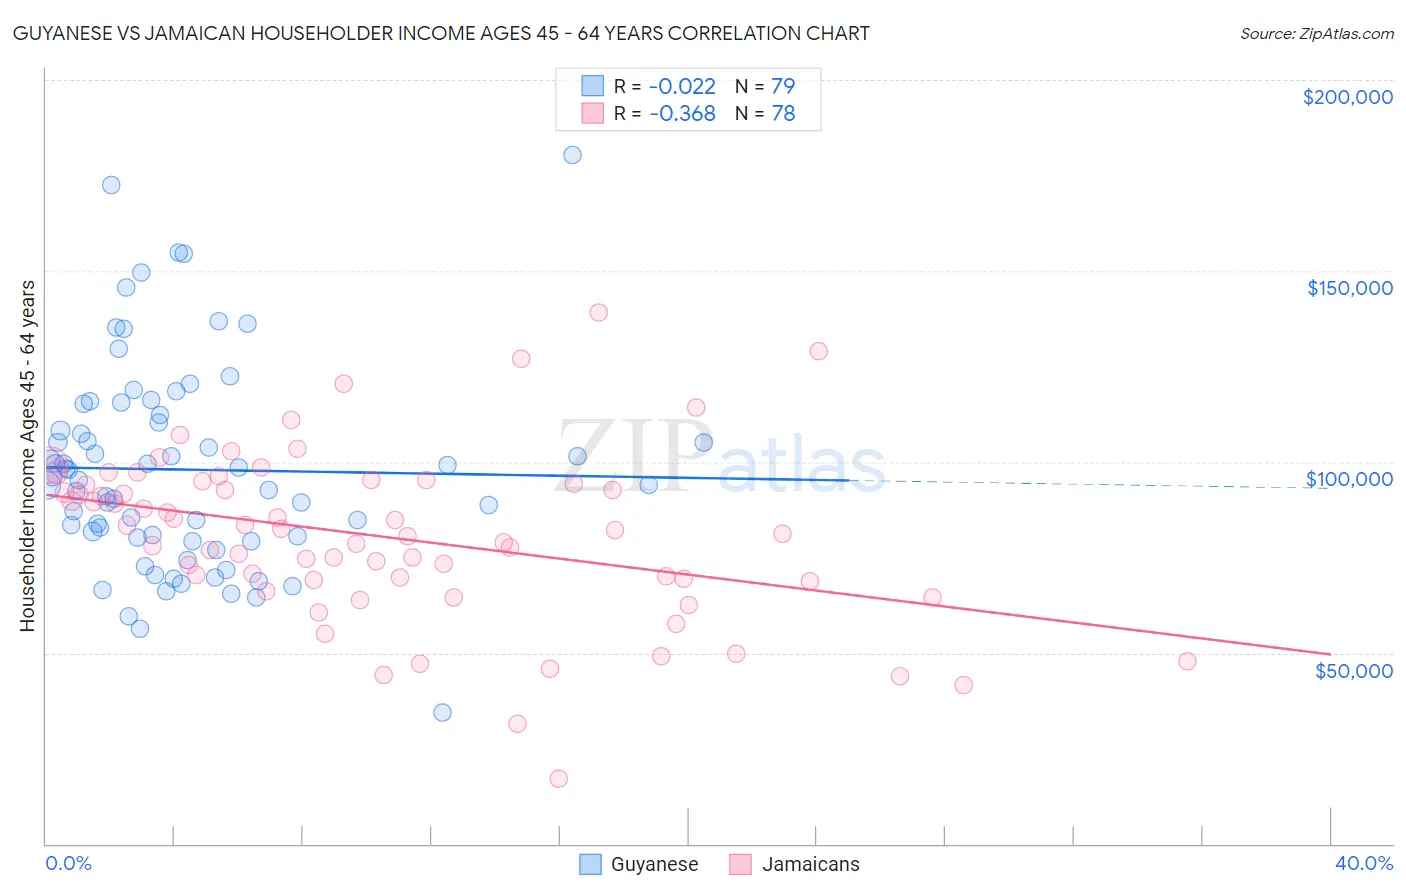
Guyanese vs Jamaican Householder Income Ages 45 - 64 years Correlation Chart
The statistical analysis conducted on geographies consisting of 176,694,986 people shows no correlation between the proportion of Guyanese and household income with householder between the ages 45 and 64 in the United States with a correlation coefficient (R) of -0.022 and weighted average of $90,966. Similarly, the statistical analysis conducted on geographies consisting of 367,130,197 people shows a mild negative correlation between the proportion of Jamaicans and household income with householder between the ages 45 and 64 in the United States with a correlation coefficient (R) of -0.368 and weighted average of $88,327, a difference of 3.0%.
Householder Income Ages 45 - 64 years Correlation Summary
| Measurement | Guyanese | Jamaican |
| Minimum | $34,531 | $17,167 |
| Maximum | $180,385 | $139,000 |
| Range | $145,854 | $121,833 |
| Mean | $97,960 | $80,364 |
| Median | $95,238 | $81,673 |
| Interquartile 25% (IQ1) | $80,177 | $68,925 |
| Interquartile 75% (IQ3) | $112,265 | $94,316 |
| Interquartile Range (IQR) | $32,087 | $25,392 |
| Standard Deviation (Sample) | $26,980 | $22,119 |
| Standard Deviation (Population) | $26,809 | $21,977 |
Demographics Similar to Guyanese and Jamaicans by Householder Income Ages 45 - 64 years
In terms of householder income ages 45 - 64 years, the demographic groups most similar to Guyanese are Central American ($90,951, a difference of 0.020%), Alaskan Athabascan ($90,951, a difference of 0.020%), Immigrants from Laos ($90,909, a difference of 0.060%), Mexican American Indian ($90,811, a difference of 0.17%), and Subsaharan African ($90,691, a difference of 0.30%). Similarly, the demographic groups most similar to Jamaicans are Osage ($88,390, a difference of 0.070%), Immigrants from Senegal ($88,421, a difference of 0.11%), Somali ($88,600, a difference of 0.31%), Belizean ($88,684, a difference of 0.40%), and Liberian ($88,929, a difference of 0.68%).
| Demographics | Rating | Rank | Householder Income Ages 45 - 64 years |
| Guyanese | 0.9 /100 | #245 | Tragic $90,966 |
| Central Americans | 0.9 /100 | #246 | Tragic $90,951 |
| Alaskan Athabascans | 0.9 /100 | #247 | Tragic $90,951 |
| Immigrants | Laos | 0.9 /100 | #248 | Tragic $90,909 |
| Mexican American Indians | 0.8 /100 | #249 | Tragic $90,811 |
| Sub-Saharan Africans | 0.8 /100 | #250 | Tragic $90,691 |
| Americans | 0.7 /100 | #251 | Tragic $90,536 |
| Marshallese | 0.7 /100 | #252 | Tragic $90,455 |
| Barbadians | 0.6 /100 | #253 | Tragic $90,266 |
| Immigrants | Guyana | 0.6 /100 | #254 | Tragic $90,186 |
| West Indians | 0.5 /100 | #255 | Tragic $89,906 |
| French American Indians | 0.5 /100 | #256 | Tragic $89,811 |
| German Russians | 0.4 /100 | #257 | Tragic $89,398 |
| Immigrants | Barbados | 0.4 /100 | #258 | Tragic $89,394 |
| Immigrants | Nicaragua | 0.4 /100 | #259 | Tragic $89,108 |
| Liberians | 0.3 /100 | #260 | Tragic $88,929 |
| Belizeans | 0.3 /100 | #261 | Tragic $88,684 |
| Somalis | 0.3 /100 | #262 | Tragic $88,600 |
| Immigrants | Senegal | 0.3 /100 | #263 | Tragic $88,421 |
| Osage | 0.3 /100 | #264 | Tragic $88,390 |
| Jamaicans | 0.2 /100 | #265 | Tragic $88,327 |