Immigrants from Malaysia vs Immigrants from Southern Europe Median Household Income
COMPARE
Immigrants from Malaysia
Immigrants from Southern Europe
Median Household Income
Median Household Income Comparison
Immigrants from Malaysia
Immigrants from Southern Europe
$96,292
MEDIAN HOUSEHOLD INCOME
99.9/ 100
METRIC RATING
49th/ 347
METRIC RANK
$91,605
MEDIAN HOUSEHOLD INCOME
98.5/ 100
METRIC RATING
98th/ 347
METRIC RANK
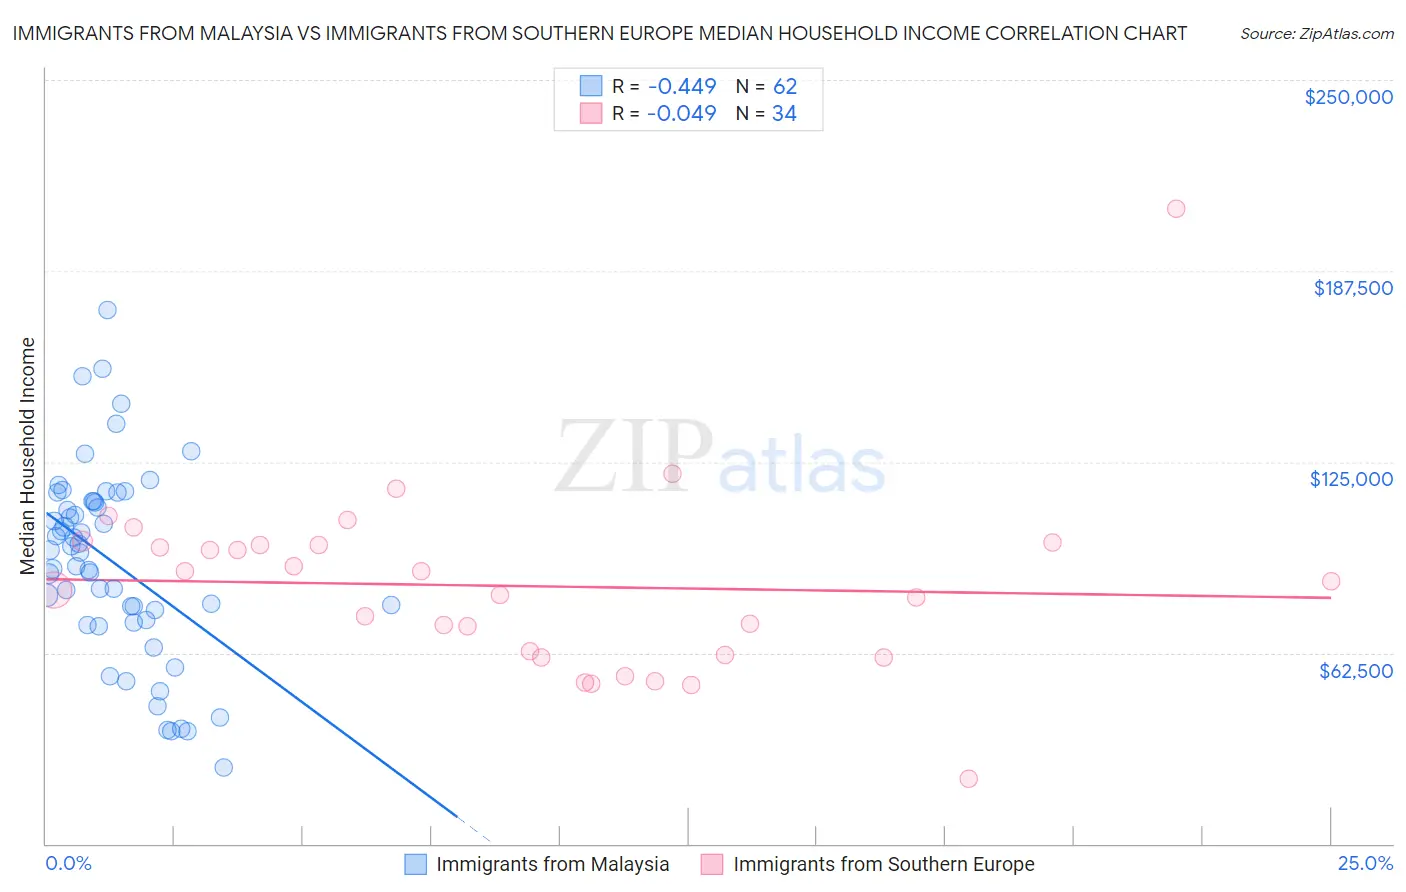
Immigrants from Malaysia vs Immigrants from Southern Europe Median Household Income Correlation Chart
The statistical analysis conducted on geographies consisting of 197,902,730 people shows a moderate negative correlation between the proportion of Immigrants from Malaysia and median household income in the United States with a correlation coefficient (R) of -0.449 and weighted average of $96,292. Similarly, the statistical analysis conducted on geographies consisting of 402,553,568 people shows no correlation between the proportion of Immigrants from Southern Europe and median household income in the United States with a correlation coefficient (R) of -0.049 and weighted average of $91,605, a difference of 5.1%.
Median Household Income Correlation Summary
| Measurement | Immigrants from Malaysia | Immigrants from Southern Europe |
| Minimum | $25,000 | $21,344 |
| Maximum | $174,680 | $207,878 |
| Range | $149,680 | $186,534 |
| Mean | $92,009 | $84,332 |
| Median | $95,719 | $84,460 |
| Interquartile 25% (IQ1) | $73,336 | $61,987 |
| Interquartile 75% (IQ3) | $111,923 | $97,991 |
| Interquartile Range (IQR) | $38,587 | $36,004 |
| Standard Deviation (Sample) | $31,412 | $31,079 |
| Standard Deviation (Population) | $31,158 | $30,619 |
Similar Demographics by Median Household Income
Demographics Similar to Immigrants from Malaysia by Median Household Income
In terms of median household income, the demographic groups most similar to Immigrants from Malaysia are Bulgarian ($96,290, a difference of 0.0%), Cambodian ($96,324, a difference of 0.030%), Immigrants from Russia ($96,378, a difference of 0.090%), Australian ($96,490, a difference of 0.21%), and Israeli ($96,552, a difference of 0.27%).
| Demographics | Rating | Rank | Median Household Income |
| Immigrants | Lithuania | 99.9 /100 | #42 | Exceptional $96,836 |
| Immigrants | France | 99.9 /100 | #43 | Exceptional $96,743 |
| Immigrants | Greece | 99.9 /100 | #44 | Exceptional $96,675 |
| Israelis | 99.9 /100 | #45 | Exceptional $96,552 |
| Australians | 99.9 /100 | #46 | Exceptional $96,490 |
| Immigrants | Russia | 99.9 /100 | #47 | Exceptional $96,378 |
| Cambodians | 99.9 /100 | #48 | Exceptional $96,324 |
| Immigrants | Malaysia | 99.9 /100 | #49 | Exceptional $96,292 |
| Bulgarians | 99.9 /100 | #50 | Exceptional $96,290 |
| Estonians | 99.9 /100 | #51 | Exceptional $95,930 |
| Immigrants | South Africa | 99.9 /100 | #52 | Exceptional $95,800 |
| Paraguayans | 99.9 /100 | #53 | Exceptional $95,737 |
| Egyptians | 99.9 /100 | #54 | Exceptional $95,673 |
| Immigrants | Czechoslovakia | 99.9 /100 | #55 | Exceptional $95,319 |
| Immigrants | Austria | 99.9 /100 | #56 | Exceptional $95,277 |
Demographics Similar to Immigrants from Southern Europe by Median Household Income
In terms of median household income, the demographic groups most similar to Immigrants from Southern Europe are Immigrants from South Eastern Asia ($91,541, a difference of 0.070%), Immigrants from Serbia ($91,730, a difference of 0.14%), Ukrainian ($91,456, a difference of 0.16%), Immigrants from Moldova ($91,446, a difference of 0.17%), and Jordanian ($91,794, a difference of 0.21%).
| Demographics | Rating | Rank | Median Household Income |
| Immigrants | Vietnam | 98.8 /100 | #91 | Exceptional $91,987 |
| Immigrants | Western Europe | 98.8 /100 | #92 | Exceptional $91,936 |
| Immigrants | Lebanon | 98.7 /100 | #93 | Exceptional $91,887 |
| Immigrants | North America | 98.7 /100 | #94 | Exceptional $91,860 |
| Armenians | 98.7 /100 | #95 | Exceptional $91,807 |
| Jordanians | 98.7 /100 | #96 | Exceptional $91,794 |
| Immigrants | Serbia | 98.6 /100 | #97 | Exceptional $91,730 |
| Immigrants | Southern Europe | 98.5 /100 | #98 | Exceptional $91,605 |
| Immigrants | South Eastern Asia | 98.4 /100 | #99 | Exceptional $91,541 |
| Ukrainians | 98.3 /100 | #100 | Exceptional $91,456 |
| Immigrants | Moldova | 98.3 /100 | #101 | Exceptional $91,446 |
| Austrians | 98.2 /100 | #102 | Exceptional $91,339 |
| Immigrants | Ukraine | 98.0 /100 | #103 | Exceptional $91,124 |
| Immigrants | Kazakhstan | 97.8 /100 | #104 | Exceptional $91,015 |
| Immigrants | Brazil | 97.7 /100 | #105 | Exceptional $90,907 |