Immigrants from Malaysia vs Australian Median Household Income
COMPARE
Immigrants from Malaysia
Australian
Median Household Income
Median Household Income Comparison
Immigrants from Malaysia
Australians
$96,292
MEDIAN HOUSEHOLD INCOME
99.9/ 100
METRIC RATING
49th/ 347
METRIC RANK
$96,490
MEDIAN HOUSEHOLD INCOME
99.9/ 100
METRIC RATING
46th/ 347
METRIC RANK
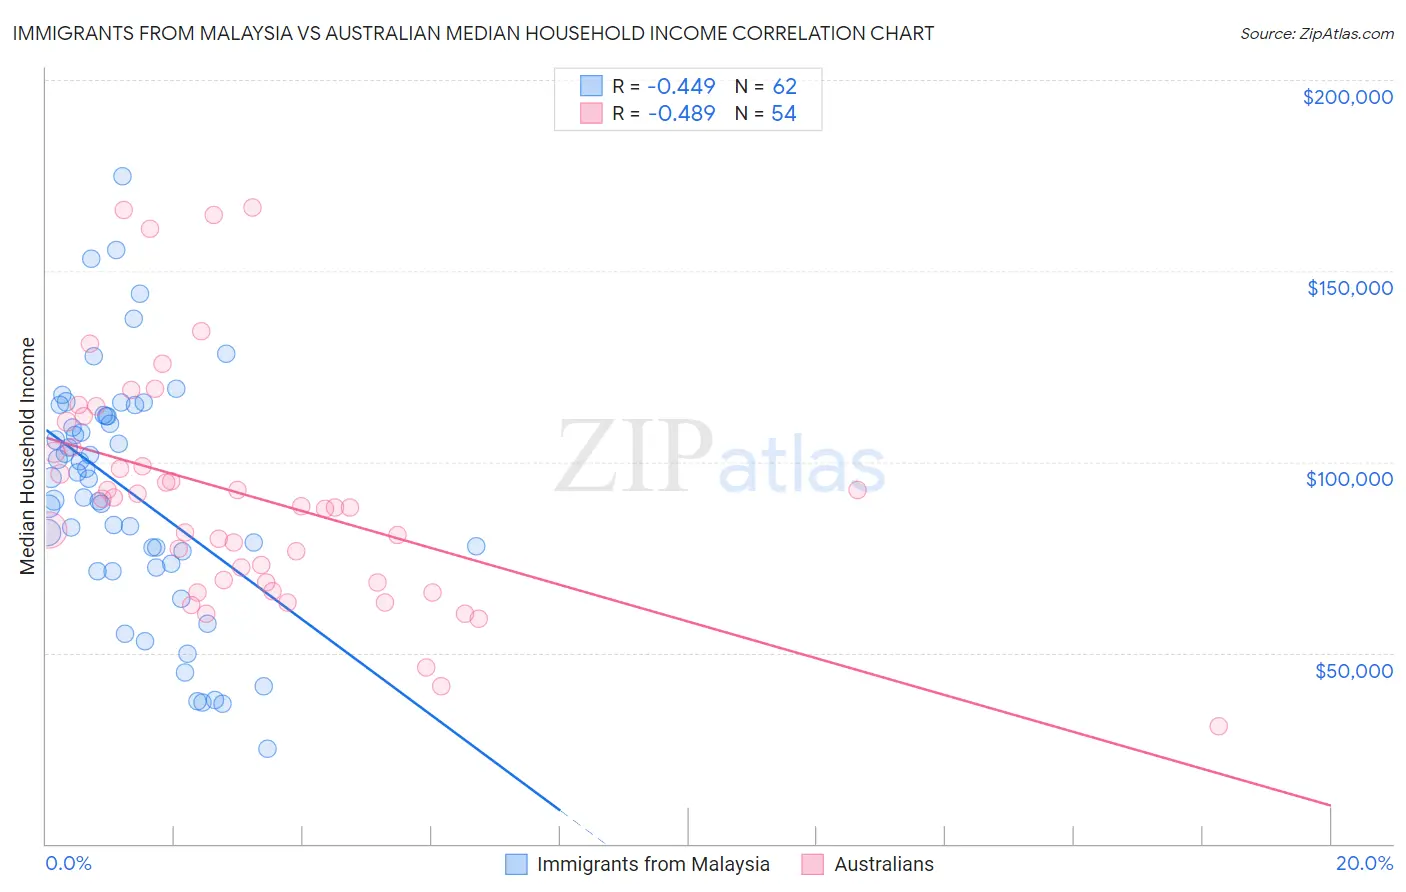
Immigrants from Malaysia vs Australian Median Household Income Correlation Chart
The statistical analysis conducted on geographies consisting of 197,902,730 people shows a moderate negative correlation between the proportion of Immigrants from Malaysia and median household income in the United States with a correlation coefficient (R) of -0.449 and weighted average of $96,292. Similarly, the statistical analysis conducted on geographies consisting of 223,978,576 people shows a moderate negative correlation between the proportion of Australians and median household income in the United States with a correlation coefficient (R) of -0.489 and weighted average of $96,490, a difference of 0.21%.
Median Household Income Correlation Summary
| Measurement | Immigrants from Malaysia | Australian |
| Minimum | $25,000 | $30,714 |
| Maximum | $174,680 | $166,528 |
| Range | $149,680 | $135,814 |
| Mean | $92,009 | $91,180 |
| Median | $95,719 | $88,142 |
| Interquartile 25% (IQ1) | $73,336 | $68,506 |
| Interquartile 75% (IQ3) | $111,923 | $103,837 |
| Interquartile Range (IQR) | $38,587 | $35,331 |
| Standard Deviation (Sample) | $31,412 | $30,330 |
| Standard Deviation (Population) | $31,158 | $30,047 |
Demographics Similar to Immigrants from Malaysia and Australians by Median Household Income
In terms of median household income, the demographic groups most similar to Immigrants from Malaysia are Bulgarian ($96,290, a difference of 0.0%), Cambodian ($96,324, a difference of 0.030%), Immigrants from Russia ($96,378, a difference of 0.090%), Israeli ($96,552, a difference of 0.27%), and Estonian ($95,930, a difference of 0.38%). Similarly, the demographic groups most similar to Australians are Israeli ($96,552, a difference of 0.060%), Immigrants from Russia ($96,378, a difference of 0.12%), Cambodian ($96,324, a difference of 0.17%), Immigrants from Greece ($96,675, a difference of 0.19%), and Bulgarian ($96,290, a difference of 0.21%).
| Demographics | Rating | Rank | Median Household Income |
| Latvians | 100.0 /100 | #37 | Exceptional $97,311 |
| Immigrants | Indonesia | 100.0 /100 | #38 | Exceptional $97,297 |
| Afghans | 100.0 /100 | #39 | Exceptional $97,026 |
| Maltese | 100.0 /100 | #40 | Exceptional $97,015 |
| Immigrants | Turkey | 100.0 /100 | #41 | Exceptional $96,964 |
| Immigrants | Lithuania | 99.9 /100 | #42 | Exceptional $96,836 |
| Immigrants | France | 99.9 /100 | #43 | Exceptional $96,743 |
| Immigrants | Greece | 99.9 /100 | #44 | Exceptional $96,675 |
| Israelis | 99.9 /100 | #45 | Exceptional $96,552 |
| Australians | 99.9 /100 | #46 | Exceptional $96,490 |
| Immigrants | Russia | 99.9 /100 | #47 | Exceptional $96,378 |
| Cambodians | 99.9 /100 | #48 | Exceptional $96,324 |
| Immigrants | Malaysia | 99.9 /100 | #49 | Exceptional $96,292 |
| Bulgarians | 99.9 /100 | #50 | Exceptional $96,290 |
| Estonians | 99.9 /100 | #51 | Exceptional $95,930 |
| Immigrants | South Africa | 99.9 /100 | #52 | Exceptional $95,800 |
| Paraguayans | 99.9 /100 | #53 | Exceptional $95,737 |
| Egyptians | 99.9 /100 | #54 | Exceptional $95,673 |
| Immigrants | Czechoslovakia | 99.9 /100 | #55 | Exceptional $95,319 |
| Immigrants | Austria | 99.9 /100 | #56 | Exceptional $95,277 |
| New Zealanders | 99.8 /100 | #57 | Exceptional $95,146 |