Arab vs Immigrants from Southern Europe Median Household Income
COMPARE
Arab
Immigrants from Southern Europe
Median Household Income
Median Household Income Comparison
Arabs
Immigrants from Southern Europe
$88,398
MEDIAN HOUSEHOLD INCOME
89.2/ 100
METRIC RATING
138th/ 347
METRIC RANK
$91,605
MEDIAN HOUSEHOLD INCOME
98.5/ 100
METRIC RATING
98th/ 347
METRIC RANK
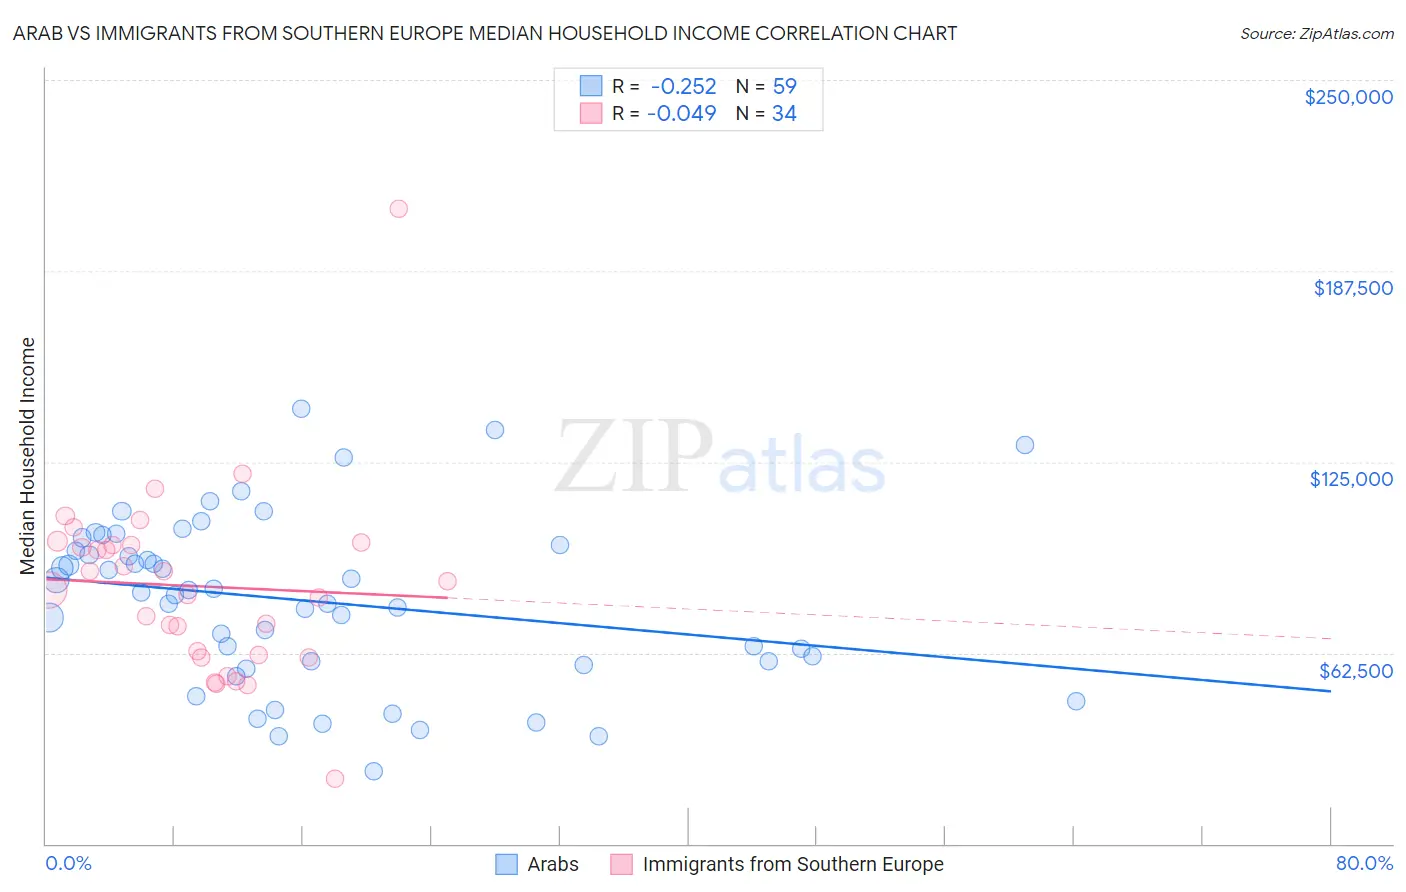
Arab vs Immigrants from Southern Europe Median Household Income Correlation Chart
The statistical analysis conducted on geographies consisting of 486,242,528 people shows a weak negative correlation between the proportion of Arabs and median household income in the United States with a correlation coefficient (R) of -0.252 and weighted average of $88,398. Similarly, the statistical analysis conducted on geographies consisting of 402,553,568 people shows no correlation between the proportion of Immigrants from Southern Europe and median household income in the United States with a correlation coefficient (R) of -0.049 and weighted average of $91,605, a difference of 3.6%.
Median Household Income Correlation Summary
| Measurement | Arab | Immigrants from Southern Europe |
| Minimum | $23,929 | $21,344 |
| Maximum | $142,260 | $207,878 |
| Range | $118,331 | $186,534 |
| Mean | $79,535 | $84,332 |
| Median | $82,260 | $84,460 |
| Interquartile 25% (IQ1) | $59,535 | $61,987 |
| Interquartile 75% (IQ3) | $97,787 | $97,991 |
| Interquartile Range (IQR) | $38,252 | $36,004 |
| Standard Deviation (Sample) | $27,234 | $31,079 |
| Standard Deviation (Population) | $27,002 | $30,619 |
Similar Demographics by Median Household Income
Demographics Similar to Arabs by Median Household Income
In terms of median household income, the demographic groups most similar to Arabs are Immigrants from Chile ($88,388, a difference of 0.010%), Sierra Leonean ($88,463, a difference of 0.070%), Polish ($88,472, a difference of 0.080%), Immigrants from Sierra Leone ($88,498, a difference of 0.11%), and Swedish ($88,524, a difference of 0.14%).
| Demographics | Rating | Rank | Median Household Income |
| Immigrants | Syria | 91.4 /100 | #131 | Exceptional $88,792 |
| Europeans | 91.2 /100 | #132 | Exceptional $88,751 |
| Immigrants | Ethiopia | 90.9 /100 | #133 | Exceptional $88,687 |
| Swedes | 90.0 /100 | #134 | Exceptional $88,524 |
| Immigrants | Sierra Leone | 89.9 /100 | #135 | Excellent $88,498 |
| Poles | 89.7 /100 | #136 | Excellent $88,472 |
| Sierra Leoneans | 89.6 /100 | #137 | Excellent $88,463 |
| Arabs | 89.2 /100 | #138 | Excellent $88,398 |
| Immigrants | Chile | 89.2 /100 | #139 | Excellent $88,388 |
| Lebanese | 87.2 /100 | #140 | Excellent $88,091 |
| Immigrants | Morocco | 86.0 /100 | #141 | Excellent $87,930 |
| Canadians | 84.7 /100 | #142 | Excellent $87,769 |
| Danes | 83.9 /100 | #143 | Excellent $87,676 |
| Serbians | 83.0 /100 | #144 | Excellent $87,572 |
| Ugandans | 82.9 /100 | #145 | Excellent $87,557 |
Demographics Similar to Immigrants from Southern Europe by Median Household Income
In terms of median household income, the demographic groups most similar to Immigrants from Southern Europe are Immigrants from South Eastern Asia ($91,541, a difference of 0.070%), Immigrants from Serbia ($91,730, a difference of 0.14%), Ukrainian ($91,456, a difference of 0.16%), Immigrants from Moldova ($91,446, a difference of 0.17%), and Jordanian ($91,794, a difference of 0.21%).
| Demographics | Rating | Rank | Median Household Income |
| Immigrants | Vietnam | 98.8 /100 | #91 | Exceptional $91,987 |
| Immigrants | Western Europe | 98.8 /100 | #92 | Exceptional $91,936 |
| Immigrants | Lebanon | 98.7 /100 | #93 | Exceptional $91,887 |
| Immigrants | North America | 98.7 /100 | #94 | Exceptional $91,860 |
| Armenians | 98.7 /100 | #95 | Exceptional $91,807 |
| Jordanians | 98.7 /100 | #96 | Exceptional $91,794 |
| Immigrants | Serbia | 98.6 /100 | #97 | Exceptional $91,730 |
| Immigrants | Southern Europe | 98.5 /100 | #98 | Exceptional $91,605 |
| Immigrants | South Eastern Asia | 98.4 /100 | #99 | Exceptional $91,541 |
| Ukrainians | 98.3 /100 | #100 | Exceptional $91,456 |
| Immigrants | Moldova | 98.3 /100 | #101 | Exceptional $91,446 |
| Austrians | 98.2 /100 | #102 | Exceptional $91,339 |
| Immigrants | Ukraine | 98.0 /100 | #103 | Exceptional $91,124 |
| Immigrants | Kazakhstan | 97.8 /100 | #104 | Exceptional $91,015 |
| Immigrants | Brazil | 97.7 /100 | #105 | Exceptional $90,907 |