Black/African American vs Immigrants from Southern Europe Median Household Income
COMPARE
Black/African American
Immigrants from Southern Europe
Median Household Income
Median Household Income Comparison
Blacks/African Americans
Immigrants from Southern Europe
$67,573
MEDIAN HOUSEHOLD INCOME
0.0/ 100
METRIC RATING
334th/ 347
METRIC RANK
$91,605
MEDIAN HOUSEHOLD INCOME
98.5/ 100
METRIC RATING
98th/ 347
METRIC RANK
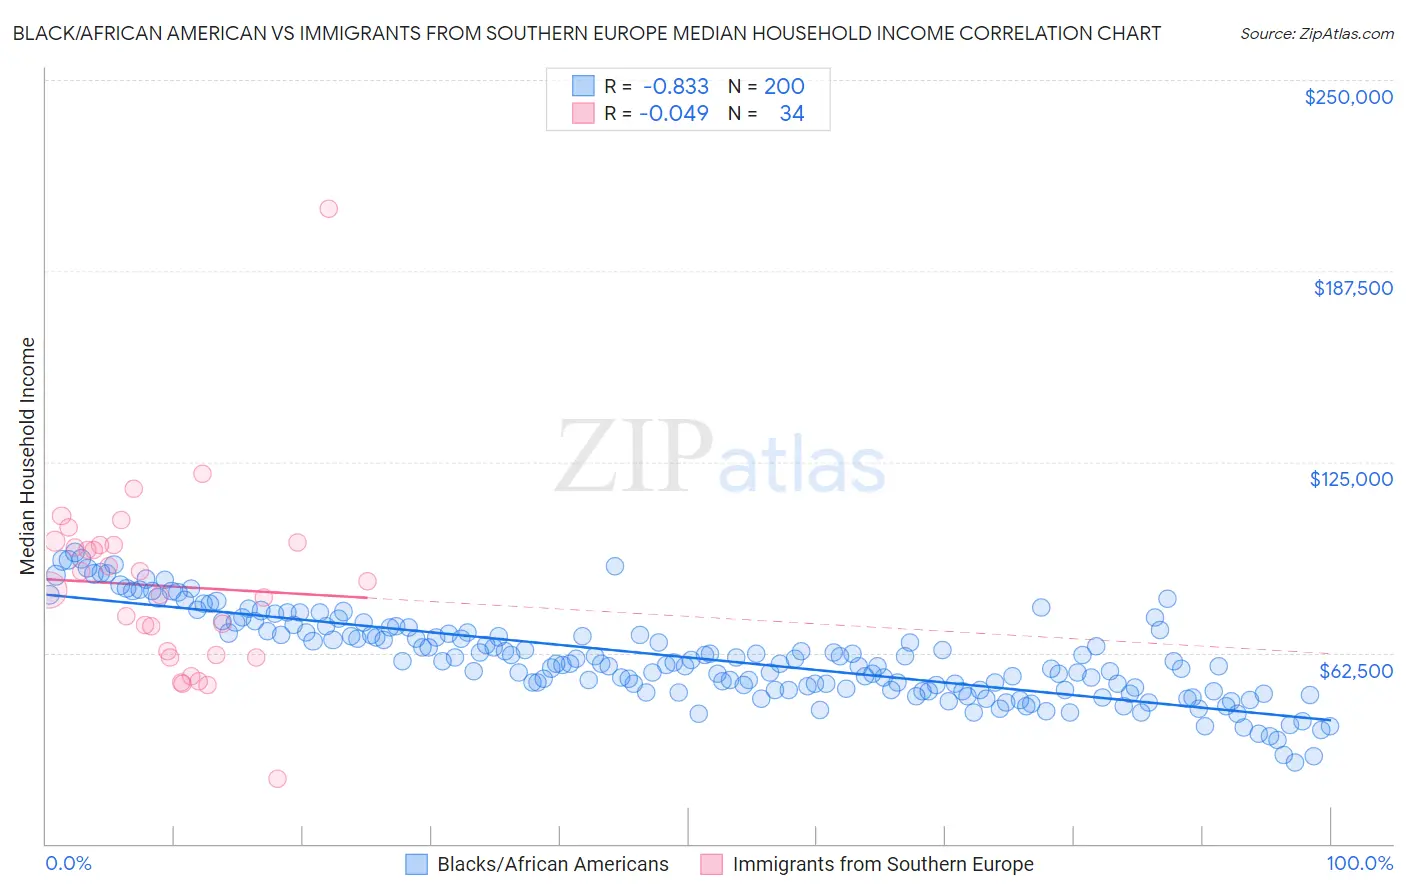
Black/African American vs Immigrants from Southern Europe Median Household Income Correlation Chart
The statistical analysis conducted on geographies consisting of 564,831,998 people shows a very strong negative correlation between the proportion of Blacks/African Americans and median household income in the United States with a correlation coefficient (R) of -0.833 and weighted average of $67,573. Similarly, the statistical analysis conducted on geographies consisting of 402,553,568 people shows no correlation between the proportion of Immigrants from Southern Europe and median household income in the United States with a correlation coefficient (R) of -0.049 and weighted average of $91,605, a difference of 35.6%.
Median Household Income Correlation Summary
| Measurement | Black/African American | Immigrants from Southern Europe |
| Minimum | $26,476 | $21,344 |
| Maximum | $95,304 | $207,878 |
| Range | $68,828 | $186,534 |
| Mean | $60,966 | $84,332 |
| Median | $59,295 | $84,460 |
| Interquartile 25% (IQ1) | $50,395 | $61,987 |
| Interquartile 75% (IQ3) | $69,686 | $97,991 |
| Interquartile Range (IQR) | $19,291 | $36,004 |
| Standard Deviation (Sample) | $14,297 | $31,079 |
| Standard Deviation (Population) | $14,261 | $30,619 |
Similar Demographics by Median Household Income
Demographics Similar to Blacks/African Americans by Median Household Income
In terms of median household income, the demographic groups most similar to Blacks/African Americans are Creek ($67,715, a difference of 0.21%), Sioux ($67,792, a difference of 0.32%), Native/Alaskan ($67,879, a difference of 0.45%), Arapaho ($67,965, a difference of 0.58%), and Cheyenne ($66,974, a difference of 0.89%).
| Demographics | Rating | Rank | Median Household Income |
| Immigrants | Cuba | 0.0 /100 | #327 | Tragic $68,461 |
| Menominee | 0.0 /100 | #328 | Tragic $68,423 |
| Dutch West Indians | 0.0 /100 | #329 | Tragic $68,412 |
| Arapaho | 0.0 /100 | #330 | Tragic $67,965 |
| Natives/Alaskans | 0.0 /100 | #331 | Tragic $67,879 |
| Sioux | 0.0 /100 | #332 | Tragic $67,792 |
| Creek | 0.0 /100 | #333 | Tragic $67,715 |
| Blacks/African Americans | 0.0 /100 | #334 | Tragic $67,573 |
| Cheyenne | 0.0 /100 | #335 | Tragic $66,974 |
| Immigrants | Congo | 0.0 /100 | #336 | Tragic $66,768 |
| Kiowa | 0.0 /100 | #337 | Tragic $65,914 |
| Immigrants | Yemen | 0.0 /100 | #338 | Tragic $65,194 |
| Hopi | 0.0 /100 | #339 | Tragic $65,043 |
| Pueblo | 0.0 /100 | #340 | Tragic $64,692 |
| Crow | 0.0 /100 | #341 | Tragic $63,681 |
Demographics Similar to Immigrants from Southern Europe by Median Household Income
In terms of median household income, the demographic groups most similar to Immigrants from Southern Europe are Immigrants from South Eastern Asia ($91,541, a difference of 0.070%), Immigrants from Serbia ($91,730, a difference of 0.14%), Ukrainian ($91,456, a difference of 0.16%), Immigrants from Moldova ($91,446, a difference of 0.17%), and Jordanian ($91,794, a difference of 0.21%).
| Demographics | Rating | Rank | Median Household Income |
| Immigrants | Vietnam | 98.8 /100 | #91 | Exceptional $91,987 |
| Immigrants | Western Europe | 98.8 /100 | #92 | Exceptional $91,936 |
| Immigrants | Lebanon | 98.7 /100 | #93 | Exceptional $91,887 |
| Immigrants | North America | 98.7 /100 | #94 | Exceptional $91,860 |
| Armenians | 98.7 /100 | #95 | Exceptional $91,807 |
| Jordanians | 98.7 /100 | #96 | Exceptional $91,794 |
| Immigrants | Serbia | 98.6 /100 | #97 | Exceptional $91,730 |
| Immigrants | Southern Europe | 98.5 /100 | #98 | Exceptional $91,605 |
| Immigrants | South Eastern Asia | 98.4 /100 | #99 | Exceptional $91,541 |
| Ukrainians | 98.3 /100 | #100 | Exceptional $91,456 |
| Immigrants | Moldova | 98.3 /100 | #101 | Exceptional $91,446 |
| Austrians | 98.2 /100 | #102 | Exceptional $91,339 |
| Immigrants | Ukraine | 98.0 /100 | #103 | Exceptional $91,124 |
| Immigrants | Kazakhstan | 97.8 /100 | #104 | Exceptional $91,015 |
| Immigrants | Brazil | 97.7 /100 | #105 | Exceptional $90,907 |