Immigrants from Malaysia vs Immigrants from Southern Europe 9th Grade
COMPARE
Immigrants from Malaysia
Immigrants from Southern Europe
9th Grade
9th Grade Comparison
Immigrants from Malaysia
Immigrants from Southern Europe
94.5%
9TH GRADE
12.2/ 100
METRIC RATING
212th/ 347
METRIC RANK
94.3%
9TH GRADE
4.5/ 100
METRIC RATING
229th/ 347
METRIC RANK
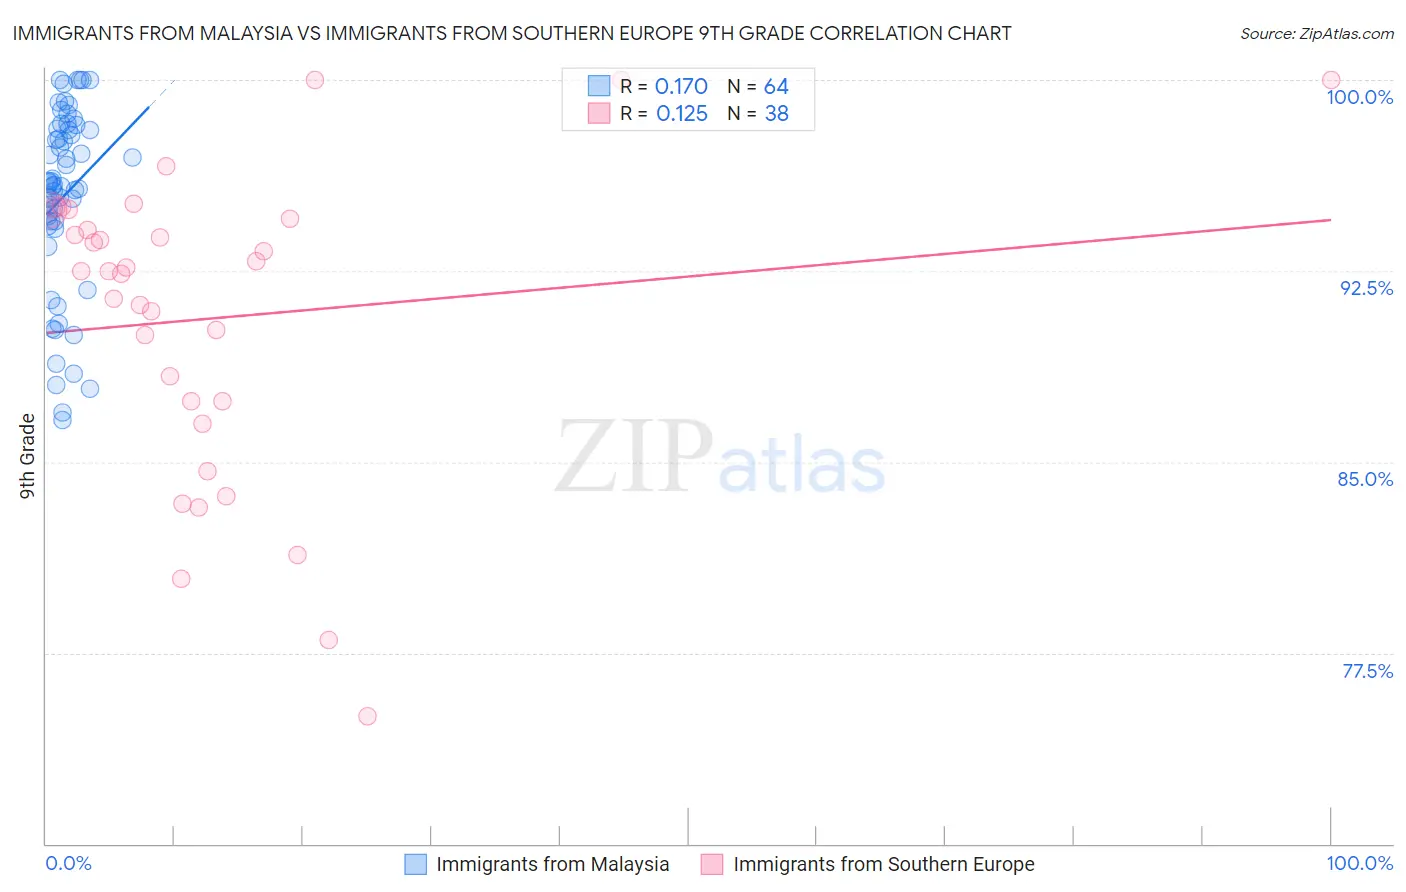
Immigrants from Malaysia vs Immigrants from Southern Europe 9th Grade Correlation Chart
The statistical analysis conducted on geographies consisting of 197,973,854 people shows a poor positive correlation between the proportion of Immigrants from Malaysia and percentage of population with at least 9th grade education in the United States with a correlation coefficient (R) of 0.170 and weighted average of 94.5%. Similarly, the statistical analysis conducted on geographies consisting of 402,804,595 people shows a poor positive correlation between the proportion of Immigrants from Southern Europe and percentage of population with at least 9th grade education in the United States with a correlation coefficient (R) of 0.125 and weighted average of 94.3%, a difference of 0.20%.
9th Grade Correlation Summary
| Measurement | Immigrants from Malaysia | Immigrants from Southern Europe |
| Minimum | 86.6% | 75.0% |
| Maximum | 100.0% | 100.0% |
| Range | 13.4% | 25.0% |
| Mean | 95.4% | 90.6% |
| Median | 95.9% | 92.5% |
| Interquartile 25% (IQ1) | 94.4% | 87.4% |
| Interquartile 75% (IQ3) | 98.1% | 94.6% |
| Interquartile Range (IQR) | 3.7% | 7.2% |
| Standard Deviation (Sample) | 3.6% | 6.0% |
| Standard Deviation (Population) | 3.5% | 5.9% |
Demographics Similar to Immigrants from Malaysia and Immigrants from Southern Europe by 9th Grade
In terms of 9th grade, the demographic groups most similar to Immigrants from Malaysia are Immigrants from Indonesia (94.5%, a difference of 0.0%), Immigrants from Oceania (94.5%, a difference of 0.0%), Immigrants from Liberia (94.5%, a difference of 0.010%), Immigrants from Chile (94.5%, a difference of 0.020%), and Immigrants from Syria (94.5%, a difference of 0.020%). Similarly, the demographic groups most similar to Immigrants from Southern Europe are Immigrants from Sierra Leone (94.4%, a difference of 0.010%), Lumbee (94.4%, a difference of 0.010%), Apache (94.3%, a difference of 0.020%), Ethiopian (94.4%, a difference of 0.030%), and Subsaharan African (94.4%, a difference of 0.030%).
| Demographics | Rating | Rank | 9th Grade |
| Immigrants | Chile | 13.4 /100 | #210 | Poor 94.5% |
| Immigrants | Indonesia | 12.3 /100 | #211 | Poor 94.5% |
| Immigrants | Malaysia | 12.2 /100 | #212 | Poor 94.5% |
| Immigrants | Oceania | 12.1 /100 | #213 | Poor 94.5% |
| Immigrants | Liberia | 11.8 /100 | #214 | Poor 94.5% |
| Immigrants | Syria | 11.0 /100 | #215 | Poor 94.5% |
| Immigrants | Western Asia | 10.7 /100 | #216 | Poor 94.5% |
| Asians | 9.9 /100 | #217 | Tragic 94.5% |
| Portuguese | 9.2 /100 | #218 | Tragic 94.5% |
| Africans | 9.0 /100 | #219 | Tragic 94.5% |
| Indians (Asian) | 8.6 /100 | #220 | Tragic 94.5% |
| Immigrants | Eastern Africa | 8.2 /100 | #221 | Tragic 94.5% |
| Immigrants | Asia | 7.7 /100 | #222 | Tragic 94.4% |
| Bahamians | 7.0 /100 | #223 | Tragic 94.4% |
| Tongans | 6.0 /100 | #224 | Tragic 94.4% |
| Ethiopians | 5.4 /100 | #225 | Tragic 94.4% |
| Sub-Saharan Africans | 5.4 /100 | #226 | Tragic 94.4% |
| Immigrants | Sierra Leone | 4.8 /100 | #227 | Tragic 94.4% |
| Lumbee | 4.7 /100 | #228 | Tragic 94.4% |
| Immigrants | Southern Europe | 4.5 /100 | #229 | Tragic 94.3% |
| Apache | 4.2 /100 | #230 | Tragic 94.3% |