Immigrants from Malaysia vs British Median Household Income
COMPARE
Immigrants from Malaysia
British
Median Household Income
Median Household Income Comparison
Immigrants from Malaysia
British
$96,292
MEDIAN HOUSEHOLD INCOME
99.9/ 100
METRIC RATING
49th/ 347
METRIC RANK
$88,914
MEDIAN HOUSEHOLD INCOME
92.0/ 100
METRIC RATING
130th/ 347
METRIC RANK
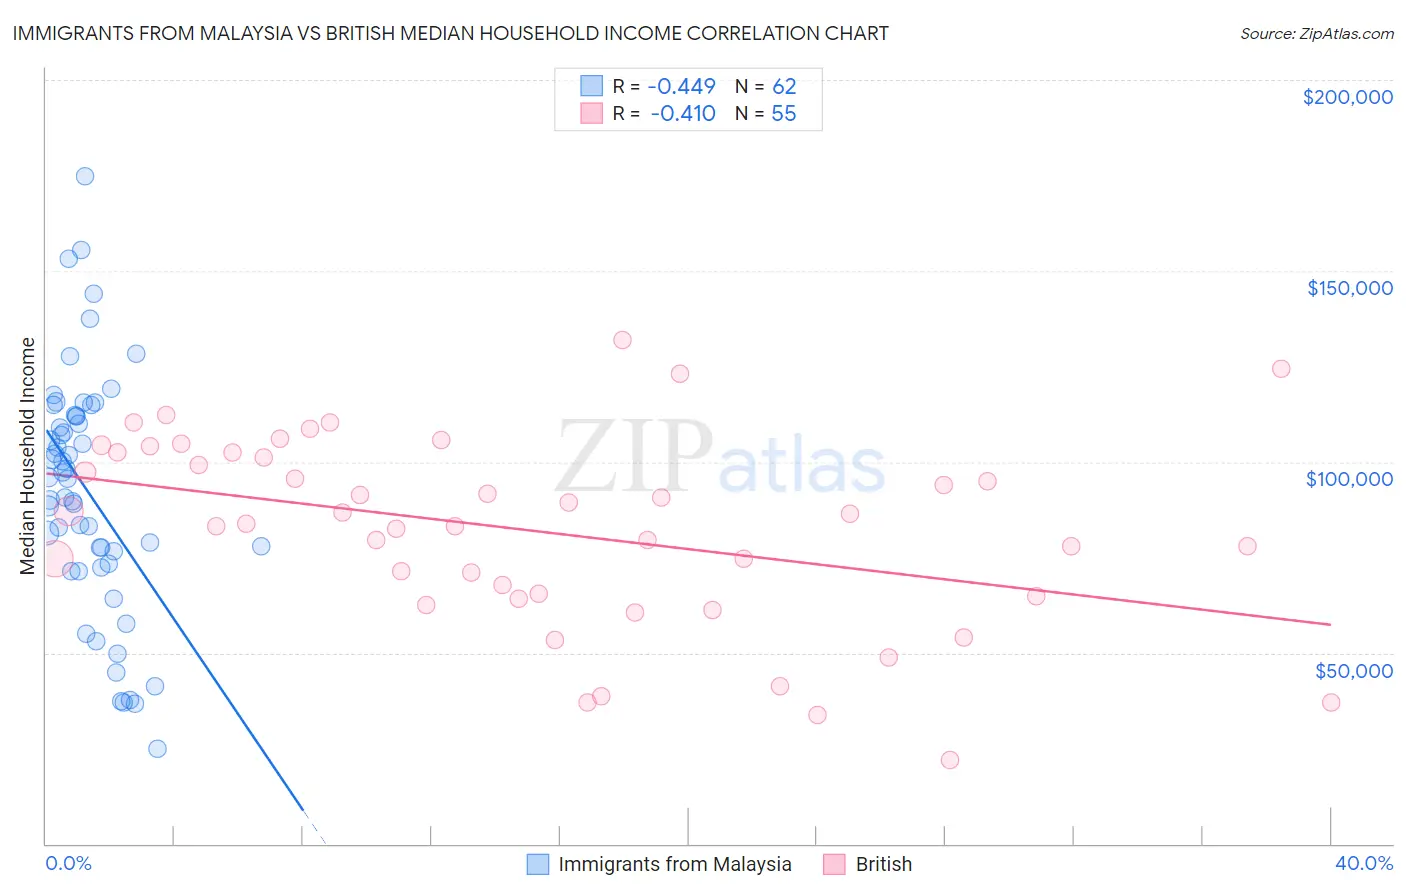
Immigrants from Malaysia vs British Median Household Income Correlation Chart
The statistical analysis conducted on geographies consisting of 197,902,730 people shows a moderate negative correlation between the proportion of Immigrants from Malaysia and median household income in the United States with a correlation coefficient (R) of -0.449 and weighted average of $96,292. Similarly, the statistical analysis conducted on geographies consisting of 530,799,157 people shows a moderate negative correlation between the proportion of British and median household income in the United States with a correlation coefficient (R) of -0.410 and weighted average of $88,914, a difference of 8.3%.
Median Household Income Correlation Summary
| Measurement | Immigrants from Malaysia | British |
| Minimum | $25,000 | $21,968 |
| Maximum | $174,680 | $131,817 |
| Range | $149,680 | $109,849 |
| Mean | $92,009 | $81,960 |
| Median | $95,719 | $83,896 |
| Interquartile 25% (IQ1) | $73,336 | $64,868 |
| Interquartile 75% (IQ3) | $111,923 | $102,423 |
| Interquartile Range (IQR) | $38,587 | $37,555 |
| Standard Deviation (Sample) | $31,412 | $24,875 |
| Standard Deviation (Population) | $31,158 | $24,648 |
Similar Demographics by Median Household Income
Demographics Similar to Immigrants from Malaysia by Median Household Income
In terms of median household income, the demographic groups most similar to Immigrants from Malaysia are Bulgarian ($96,290, a difference of 0.0%), Cambodian ($96,324, a difference of 0.030%), Immigrants from Russia ($96,378, a difference of 0.090%), Australian ($96,490, a difference of 0.21%), and Israeli ($96,552, a difference of 0.27%).
| Demographics | Rating | Rank | Median Household Income |
| Immigrants | Lithuania | 99.9 /100 | #42 | Exceptional $96,836 |
| Immigrants | France | 99.9 /100 | #43 | Exceptional $96,743 |
| Immigrants | Greece | 99.9 /100 | #44 | Exceptional $96,675 |
| Israelis | 99.9 /100 | #45 | Exceptional $96,552 |
| Australians | 99.9 /100 | #46 | Exceptional $96,490 |
| Immigrants | Russia | 99.9 /100 | #47 | Exceptional $96,378 |
| Cambodians | 99.9 /100 | #48 | Exceptional $96,324 |
| Immigrants | Malaysia | 99.9 /100 | #49 | Exceptional $96,292 |
| Bulgarians | 99.9 /100 | #50 | Exceptional $96,290 |
| Estonians | 99.9 /100 | #51 | Exceptional $95,930 |
| Immigrants | South Africa | 99.9 /100 | #52 | Exceptional $95,800 |
| Paraguayans | 99.9 /100 | #53 | Exceptional $95,737 |
| Egyptians | 99.9 /100 | #54 | Exceptional $95,673 |
| Immigrants | Czechoslovakia | 99.9 /100 | #55 | Exceptional $95,319 |
| Immigrants | Austria | 99.9 /100 | #56 | Exceptional $95,277 |
Demographics Similar to British by Median Household Income
In terms of median household income, the demographic groups most similar to British are Brazilian ($88,934, a difference of 0.020%), Portuguese ($88,976, a difference of 0.070%), Immigrants from Peru ($89,010, a difference of 0.11%), Immigrants from Syria ($88,792, a difference of 0.14%), and European ($88,751, a difference of 0.18%).
| Demographics | Rating | Rank | Median Household Income |
| Immigrants | Zimbabwe | 94.4 /100 | #123 | Exceptional $89,496 |
| Immigrants | Jordan | 94.1 /100 | #124 | Exceptional $89,412 |
| Immigrants | Kuwait | 93.5 /100 | #125 | Exceptional $89,263 |
| Immigrants | Oceania | 92.9 /100 | #126 | Exceptional $89,100 |
| Immigrants | Peru | 92.5 /100 | #127 | Exceptional $89,010 |
| Portuguese | 92.3 /100 | #128 | Exceptional $88,976 |
| Brazilians | 92.1 /100 | #129 | Exceptional $88,934 |
| British | 92.0 /100 | #130 | Exceptional $88,914 |
| Immigrants | Syria | 91.4 /100 | #131 | Exceptional $88,792 |
| Europeans | 91.2 /100 | #132 | Exceptional $88,751 |
| Immigrants | Ethiopia | 90.9 /100 | #133 | Exceptional $88,687 |
| Swedes | 90.0 /100 | #134 | Exceptional $88,524 |
| Immigrants | Sierra Leone | 89.9 /100 | #135 | Excellent $88,498 |
| Poles | 89.7 /100 | #136 | Excellent $88,472 |
| Sierra Leoneans | 89.6 /100 | #137 | Excellent $88,463 |