Assyrian/Chaldean/Syriac vs Immigrants from Switzerland Wage/Income Gap
COMPARE
Assyrian/Chaldean/Syriac
Immigrants from Switzerland
Wage/Income Gap
Wage/Income Gap Comparison
Assyrians/Chaldeans/Syriacs
Immigrants from Switzerland
31.0%
WAGE/INCOME GAP
0.0/ 100
METRIC RATING
344th/ 347
METRIC RANK
27.7%
WAGE/INCOME GAP
1.0/ 100
METRIC RATING
264th/ 347
METRIC RANK
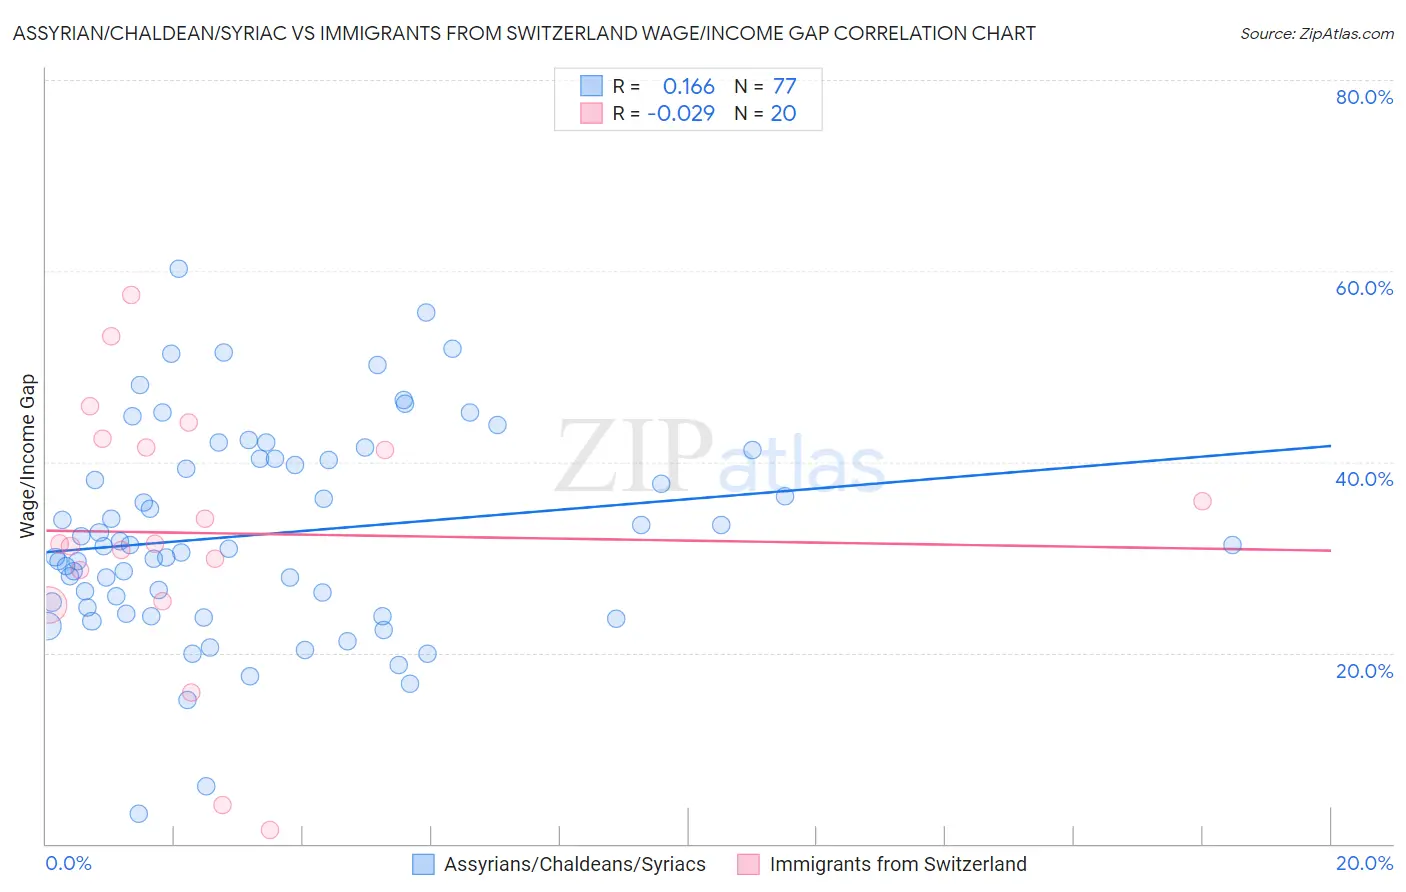
Assyrian/Chaldean/Syriac vs Immigrants from Switzerland Wage/Income Gap Correlation Chart
The statistical analysis conducted on geographies consisting of 110,300,897 people shows a poor positive correlation between the proportion of Assyrians/Chaldeans/Syriacs and wage/income gap percentage in the United States with a correlation coefficient (R) of 0.166 and weighted average of 31.0%. Similarly, the statistical analysis conducted on geographies consisting of 148,012,868 people shows no correlation between the proportion of Immigrants from Switzerland and wage/income gap percentage in the United States with a correlation coefficient (R) of -0.029 and weighted average of 27.7%, a difference of 11.9%.
Wage/Income Gap Correlation Summary
| Measurement | Assyrian/Chaldean/Syriac | Immigrants from Switzerland |
| Minimum | 3.1% | 1.5% |
| Maximum | 60.2% | 57.5% |
| Range | 57.1% | 56.0% |
| Mean | 32.4% | 32.5% |
| Median | 31.2% | 31.4% |
| Interquartile 25% (IQ1) | 24.4% | 27.1% |
| Interquartile 75% (IQ3) | 40.3% | 42.0% |
| Interquartile Range (IQR) | 15.9% | 14.9% |
| Standard Deviation (Sample) | 10.9% | 14.2% |
| Standard Deviation (Population) | 10.9% | 13.8% |
Similar Demographics by Wage/Income Gap
Demographics Similar to Assyrians/Chaldeans/Syriacs by Wage/Income Gap
In terms of wage/income gap, the demographic groups most similar to Assyrians/Chaldeans/Syriacs are Danish (31.0%, a difference of 0.13%), Pennsylvania German (30.7%, a difference of 0.97%), Immigrants from India (31.5%, a difference of 1.7%), Thai (30.5%, a difference of 1.8%), and Swiss (30.0%, a difference of 3.4%).
| Demographics | Rating | Rank | Wage/Income Gap |
| Europeans | 0.0 /100 | #333 | Tragic 29.4% |
| Swedes | 0.0 /100 | #334 | Tragic 29.4% |
| Immigrants | Taiwan | 0.0 /100 | #335 | Tragic 29.5% |
| English | 0.0 /100 | #336 | Tragic 29.5% |
| Dutch | 0.0 /100 | #337 | Tragic 29.6% |
| Filipinos | 0.0 /100 | #338 | Tragic 29.7% |
| Iranians | 0.0 /100 | #339 | Tragic 29.7% |
| Swiss | 0.0 /100 | #340 | Tragic 30.0% |
| Thais | 0.0 /100 | #341 | Tragic 30.5% |
| Pennsylvania Germans | 0.0 /100 | #342 | Tragic 30.7% |
| Danes | 0.0 /100 | #343 | Tragic 31.0% |
| Assyrians/Chaldeans/Syriacs | 0.0 /100 | #344 | Tragic 31.0% |
| Immigrants | India | 0.0 /100 | #345 | Tragic 31.5% |
| Cajuns | 0.0 /100 | #346 | Tragic 33.9% |
| Houma | 0.0 /100 | #347 | Tragic 38.7% |
Demographics Similar to Immigrants from Switzerland by Wage/Income Gap
In terms of wage/income gap, the demographic groups most similar to Immigrants from Switzerland are Serbian (27.7%, a difference of 0.0%), Hmong (27.7%, a difference of 0.010%), Turkish (27.7%, a difference of 0.020%), New Zealander (27.7%, a difference of 0.10%), and Potawatomi (27.7%, a difference of 0.12%).
| Demographics | Rating | Rank | Wage/Income Gap |
| Luxembourgers | 1.9 /100 | #257 | Tragic 27.4% |
| Slavs | 1.8 /100 | #258 | Tragic 27.4% |
| Icelanders | 1.8 /100 | #259 | Tragic 27.5% |
| Tongans | 1.7 /100 | #260 | Tragic 27.5% |
| Immigrants | Germany | 1.5 /100 | #261 | Tragic 27.5% |
| Immigrants | Lebanon | 1.5 /100 | #262 | Tragic 27.5% |
| Syrians | 1.4 /100 | #263 | Tragic 27.6% |
| Immigrants | Switzerland | 1.0 /100 | #264 | Tragic 27.7% |
| Serbians | 1.0 /100 | #265 | Tragic 27.7% |
| Hmong | 1.0 /100 | #266 | Tragic 27.7% |
| Turks | 1.0 /100 | #267 | Tragic 27.7% |
| New Zealanders | 1.0 /100 | #268 | Tragic 27.7% |
| Potawatomi | 0.9 /100 | #269 | Tragic 27.7% |
| Immigrants | Western Europe | 0.9 /100 | #270 | Tragic 27.8% |
| Ute | 0.8 /100 | #271 | Tragic 27.8% |