Immigrants from Israel vs Nepalese Median Female Earnings
COMPARE
Immigrants from Israel
Nepalese
Median Female Earnings
Median Female Earnings Comparison
Immigrants from Israel
Nepalese
$46,902
MEDIAN FEMALE EARNINGS
100.0/ 100
METRIC RATING
12th/ 347
METRIC RANK
$38,603
MEDIAN FEMALE EARNINGS
9.3/ 100
METRIC RATING
219th/ 347
METRIC RANK
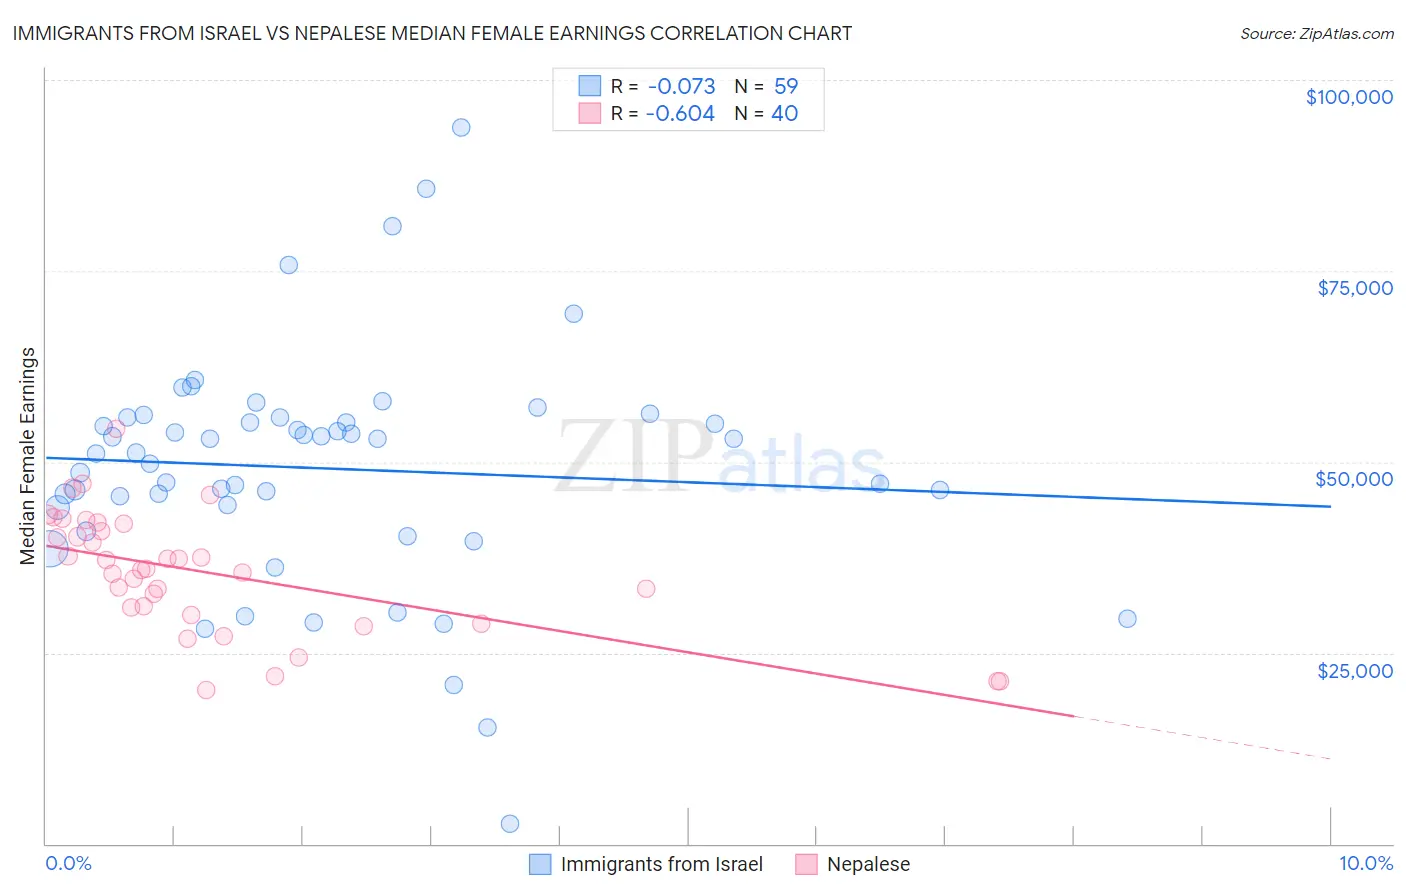
Immigrants from Israel vs Nepalese Median Female Earnings Correlation Chart
The statistical analysis conducted on geographies consisting of 209,992,905 people shows a slight negative correlation between the proportion of Immigrants from Israel and median female earnings in the United States with a correlation coefficient (R) of -0.073 and weighted average of $46,902. Similarly, the statistical analysis conducted on geographies consisting of 24,521,755 people shows a significant negative correlation between the proportion of Nepalese and median female earnings in the United States with a correlation coefficient (R) of -0.604 and weighted average of $38,603, a difference of 21.5%.
Median Female Earnings Correlation Summary
| Measurement | Immigrants from Israel | Nepalese |
| Minimum | $2,606 | $20,210 |
| Maximum | $93,787 | $54,407 |
| Range | $91,181 | $34,197 |
| Mean | $49,152 | $35,483 |
| Median | $51,157 | $35,860 |
| Interquartile 25% (IQ1) | $44,051 | $30,426 |
| Interquartile 75% (IQ3) | $55,815 | $41,423 |
| Interquartile Range (IQR) | $11,764 | $10,997 |
| Standard Deviation (Sample) | $15,373 | $7,837 |
| Standard Deviation (Population) | $15,242 | $7,738 |
Similar Demographics by Median Female Earnings
Demographics Similar to Immigrants from Israel by Median Female Earnings
In terms of median female earnings, the demographic groups most similar to Immigrants from Israel are Okinawan ($46,905, a difference of 0.010%), Immigrants from China ($46,972, a difference of 0.15%), Immigrants from Iran ($47,154, a difference of 0.54%), Immigrants from Australia ($46,573, a difference of 0.71%), and Soviet Union ($46,556, a difference of 0.74%).
| Demographics | Rating | Rank | Median Female Earnings |
| Immigrants | Singapore | 100.0 /100 | #5 | Exceptional $47,986 |
| Immigrants | Ireland | 100.0 /100 | #6 | Exceptional $47,598 |
| Thais | 100.0 /100 | #7 | Exceptional $47,577 |
| Iranians | 100.0 /100 | #8 | Exceptional $47,421 |
| Immigrants | Iran | 100.0 /100 | #9 | Exceptional $47,154 |
| Immigrants | China | 100.0 /100 | #10 | Exceptional $46,972 |
| Okinawans | 100.0 /100 | #11 | Exceptional $46,905 |
| Immigrants | Israel | 100.0 /100 | #12 | Exceptional $46,902 |
| Immigrants | Australia | 100.0 /100 | #13 | Exceptional $46,573 |
| Soviet Union | 100.0 /100 | #14 | Exceptional $46,556 |
| Immigrants | Eastern Asia | 100.0 /100 | #15 | Exceptional $46,502 |
| Indians (Asian) | 100.0 /100 | #16 | Exceptional $46,481 |
| Immigrants | South Central Asia | 100.0 /100 | #17 | Exceptional $46,324 |
| Cypriots | 100.0 /100 | #18 | Exceptional $45,570 |
| Eastern Europeans | 100.0 /100 | #19 | Exceptional $45,385 |
Demographics Similar to Nepalese by Median Female Earnings
In terms of median female earnings, the demographic groups most similar to Nepalese are Cape Verdean ($38,614, a difference of 0.030%), Immigrants from Jamaica ($38,625, a difference of 0.060%), Yugoslavian ($38,573, a difference of 0.080%), Immigrants from the Azores ($38,573, a difference of 0.080%), and Immigrants from Ecuador ($38,644, a difference of 0.11%).
| Demographics | Rating | Rank | Median Female Earnings |
| Guamanians/Chamorros | 11.5 /100 | #212 | Poor $38,717 |
| Jamaicans | 10.5 /100 | #213 | Poor $38,670 |
| Iraqis | 10.5 /100 | #214 | Poor $38,666 |
| Spaniards | 10.3 /100 | #215 | Poor $38,656 |
| Immigrants | Ecuador | 10.1 /100 | #216 | Poor $38,644 |
| Immigrants | Jamaica | 9.7 /100 | #217 | Tragic $38,625 |
| Cape Verdeans | 9.5 /100 | #218 | Tragic $38,614 |
| Nepalese | 9.3 /100 | #219 | Tragic $38,603 |
| Yugoslavians | 8.8 /100 | #220 | Tragic $38,573 |
| Immigrants | Azores | 8.8 /100 | #221 | Tragic $38,573 |
| Japanese | 8.1 /100 | #222 | Tragic $38,528 |
| Immigrants | Sudan | 7.8 /100 | #223 | Tragic $38,511 |
| Native Hawaiians | 7.1 /100 | #224 | Tragic $38,461 |
| French | 7.0 /100 | #225 | Tragic $38,457 |
| French Canadians | 6.8 /100 | #226 | Tragic $38,436 |