Immigrants from Dominica vs Iranian Median Earnings
COMPARE
Immigrants from Dominica
Iranian
Median Earnings
Median Earnings Comparison
Immigrants from Dominica
Iranians
$42,420
MEDIAN EARNINGS
0.4/ 100
METRIC RATING
273rd/ 347
METRIC RANK
$58,474
MEDIAN EARNINGS
100.0/ 100
METRIC RATING
7th/ 347
METRIC RANK
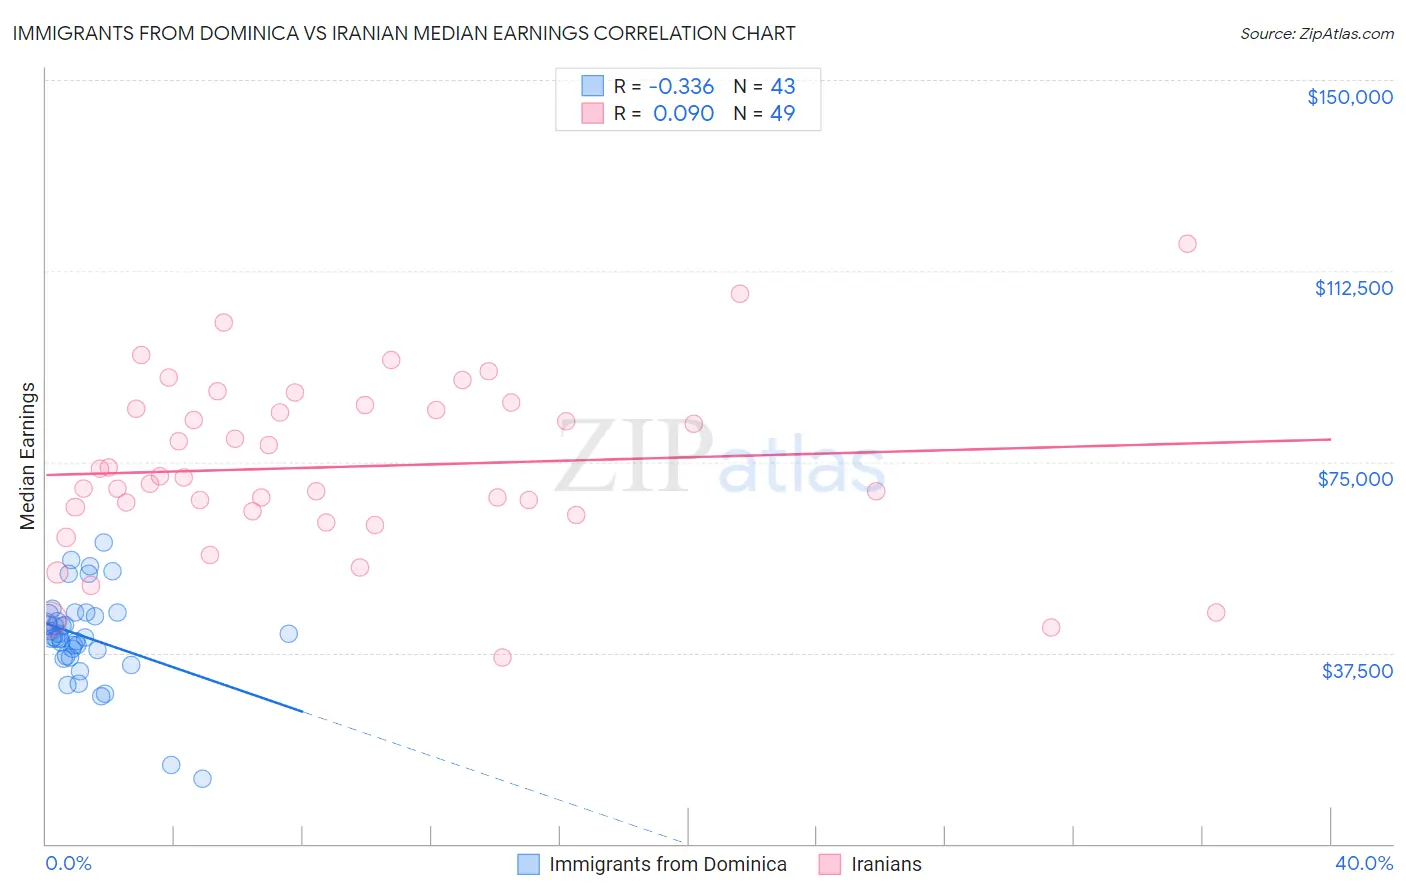
Immigrants from Dominica vs Iranian Median Earnings Correlation Chart
The statistical analysis conducted on geographies consisting of 83,794,141 people shows a mild negative correlation between the proportion of Immigrants from Dominica and median earnings in the United States with a correlation coefficient (R) of -0.336 and weighted average of $42,420. Similarly, the statistical analysis conducted on geographies consisting of 316,848,979 people shows a slight positive correlation between the proportion of Iranians and median earnings in the United States with a correlation coefficient (R) of 0.090 and weighted average of $58,474, a difference of 37.9%.
Median Earnings Correlation Summary
| Measurement | Immigrants from Dominica | Iranian |
| Minimum | $12,717 | $36,458 |
| Maximum | $59,056 | $117,883 |
| Range | $46,339 | $81,425 |
| Mean | $40,644 | $74,068 |
| Median | $40,628 | $72,050 |
| Interquartile 25% (IQ1) | $36,948 | $64,975 |
| Interquartile 75% (IQ3) | $45,188 | $85,806 |
| Interquartile Range (IQR) | $8,240 | $20,831 |
| Standard Deviation (Sample) | $8,982 | $17,049 |
| Standard Deviation (Population) | $8,876 | $16,874 |
Similar Demographics by Median Earnings
Demographics Similar to Immigrants from Dominica by Median Earnings
In terms of median earnings, the demographic groups most similar to Immigrants from Dominica are Immigrants from El Salvador ($42,413, a difference of 0.020%), Iroquois ($42,430, a difference of 0.030%), Immigrants from Belize ($42,339, a difference of 0.19%), Spanish American ($42,316, a difference of 0.25%), and Central American ($42,280, a difference of 0.33%).
| Demographics | Rating | Rank | Median Earnings |
| Immigrants | Laos | 0.7 /100 | #266 | Tragic $42,884 |
| Cree | 0.6 /100 | #267 | Tragic $42,777 |
| Americans | 0.6 /100 | #268 | Tragic $42,742 |
| Belizeans | 0.5 /100 | #269 | Tragic $42,702 |
| Osage | 0.5 /100 | #270 | Tragic $42,651 |
| Pennsylvania Germans | 0.5 /100 | #271 | Tragic $42,615 |
| Iroquois | 0.4 /100 | #272 | Tragic $42,430 |
| Immigrants | Dominica | 0.4 /100 | #273 | Tragic $42,420 |
| Immigrants | El Salvador | 0.4 /100 | #274 | Tragic $42,413 |
| Immigrants | Belize | 0.3 /100 | #275 | Tragic $42,339 |
| Spanish Americans | 0.3 /100 | #276 | Tragic $42,316 |
| Central Americans | 0.3 /100 | #277 | Tragic $42,280 |
| Cajuns | 0.3 /100 | #278 | Tragic $42,189 |
| Colville | 0.2 /100 | #279 | Tragic $42,151 |
| Hmong | 0.2 /100 | #280 | Tragic $42,111 |
Demographics Similar to Iranians by Median Earnings
In terms of median earnings, the demographic groups most similar to Iranians are Immigrants from Singapore ($59,038, a difference of 0.97%), Thai ($59,237, a difference of 1.3%), Immigrants from Iran ($57,612, a difference of 1.5%), Okinawan ($57,550, a difference of 1.6%), and Immigrants from Hong Kong ($59,433, a difference of 1.6%).
| Demographics | Rating | Rank | Median Earnings |
| Filipinos | 100.0 /100 | #1 | Exceptional $61,197 |
| Immigrants | Taiwan | 100.0 /100 | #2 | Exceptional $61,151 |
| Immigrants | India | 100.0 /100 | #3 | Exceptional $60,648 |
| Immigrants | Hong Kong | 100.0 /100 | #4 | Exceptional $59,433 |
| Thais | 100.0 /100 | #5 | Exceptional $59,237 |
| Immigrants | Singapore | 100.0 /100 | #6 | Exceptional $59,038 |
| Iranians | 100.0 /100 | #7 | Exceptional $58,474 |
| Immigrants | Iran | 100.0 /100 | #8 | Exceptional $57,612 |
| Okinawans | 100.0 /100 | #9 | Exceptional $57,550 |
| Immigrants | South Central Asia | 100.0 /100 | #10 | Exceptional $57,114 |
| Immigrants | Israel | 100.0 /100 | #11 | Exceptional $57,034 |
| Immigrants | Ireland | 100.0 /100 | #12 | Exceptional $56,854 |
| Immigrants | China | 100.0 /100 | #13 | Exceptional $56,638 |
| Immigrants | Australia | 100.0 /100 | #14 | Exceptional $56,305 |
| Indians (Asian) | 100.0 /100 | #15 | Exceptional $56,253 |