Immigrants from Latvia vs Luxembourger Disability Age 35 to 64
COMPARE
Immigrants from Latvia
Luxembourger
Disability Age 35 to 64
Disability Age 35 to 64 Comparison
Immigrants from Latvia
Luxembourgers
10.1%
DISABILITY AGE 35 TO 64
99.4/ 100
METRIC RATING
75th/ 347
METRIC RANK
10.6%
DISABILITY AGE 35 TO 64
95.5/ 100
METRIC RATING
119th/ 347
METRIC RANK
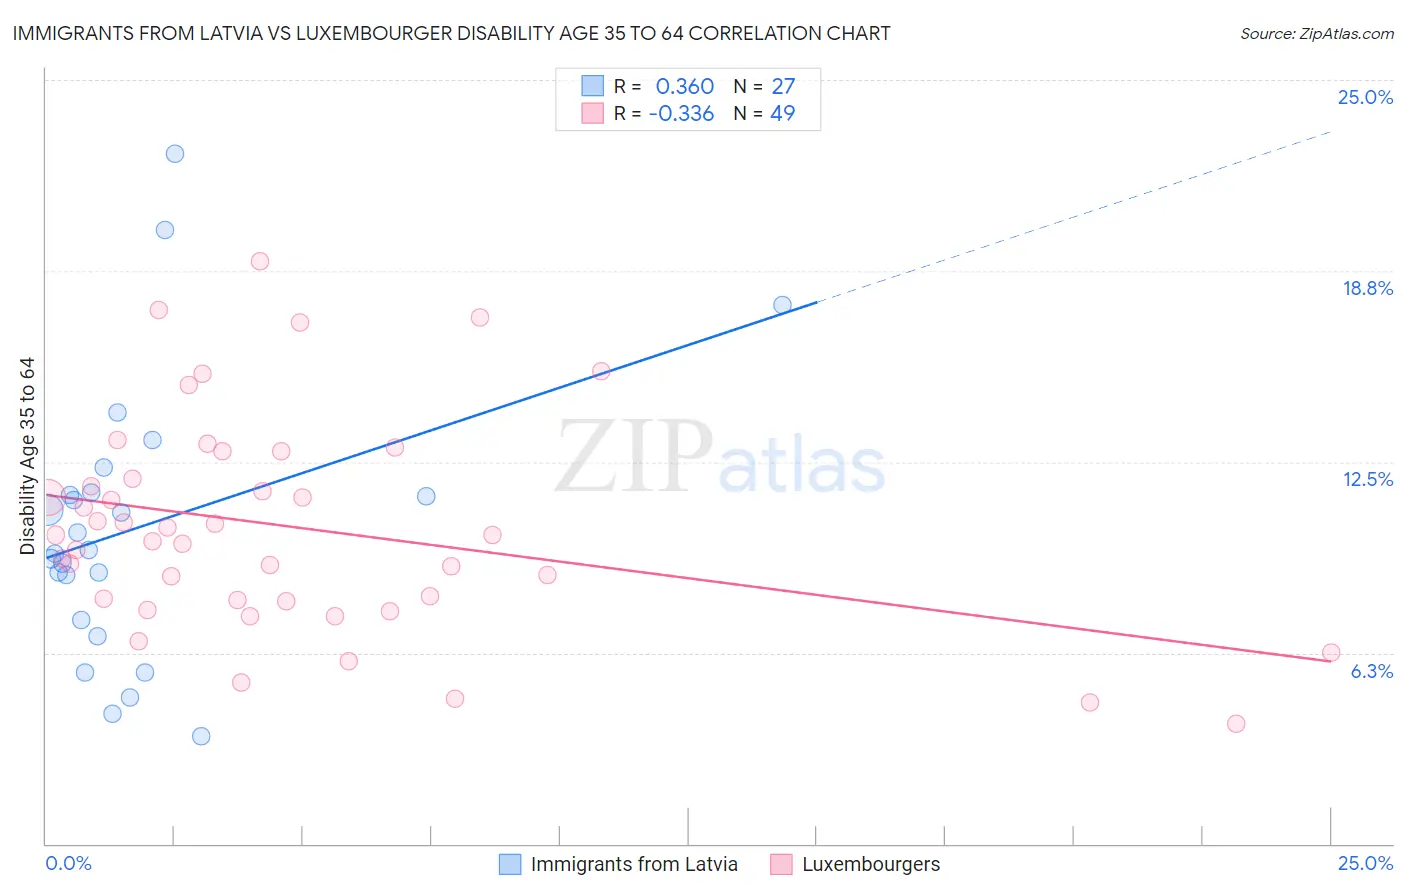
Immigrants from Latvia vs Luxembourger Disability Age 35 to 64 Correlation Chart
The statistical analysis conducted on geographies consisting of 113,723,029 people shows a mild positive correlation between the proportion of Immigrants from Latvia and percentage of population with a disability between the ages 34 and 64 in the United States with a correlation coefficient (R) of 0.360 and weighted average of 10.1%. Similarly, the statistical analysis conducted on geographies consisting of 144,643,404 people shows a mild negative correlation between the proportion of Luxembourgers and percentage of population with a disability between the ages 34 and 64 in the United States with a correlation coefficient (R) of -0.336 and weighted average of 10.6%, a difference of 4.5%.
Disability Age 35 to 64 Correlation Summary
| Measurement | Immigrants from Latvia | Luxembourger |
| Minimum | 3.5% | 3.9% |
| Maximum | 22.6% | 19.1% |
| Range | 19.1% | 15.1% |
| Mean | 10.4% | 10.3% |
| Median | 9.6% | 10.1% |
| Interquartile 25% (IQ1) | 7.3% | 7.9% |
| Interquartile 75% (IQ3) | 11.5% | 12.4% |
| Interquartile Range (IQR) | 4.2% | 4.4% |
| Standard Deviation (Sample) | 4.5% | 3.5% |
| Standard Deviation (Population) | 4.4% | 3.4% |
Similar Demographics by Disability Age 35 to 64
Demographics Similar to Immigrants from Latvia by Disability Age 35 to 64
In terms of disability age 35 to 64, the demographic groups most similar to Immigrants from Latvia are Immigrants from Chile (10.1%, a difference of 0.010%), Mongolian (10.1%, a difference of 0.040%), Laotian (10.1%, a difference of 0.090%), Jordanian (10.1%, a difference of 0.18%), and Immigrants from Vietnam (10.1%, a difference of 0.26%).
| Demographics | Rating | Rank | Disability Age 35 to 64 |
| Immigrants | Switzerland | 99.5 /100 | #68 | Exceptional 10.1% |
| Immigrants | Eastern Europe | 99.5 /100 | #69 | Exceptional 10.1% |
| Immigrants | Nicaragua | 99.5 /100 | #70 | Exceptional 10.1% |
| Immigrants | Kazakhstan | 99.5 /100 | #71 | Exceptional 10.1% |
| Immigrants | Northern Europe | 99.5 /100 | #72 | Exceptional 10.1% |
| Immigrants | France | 99.5 /100 | #73 | Exceptional 10.1% |
| Laotians | 99.4 /100 | #74 | Exceptional 10.1% |
| Immigrants | Latvia | 99.4 /100 | #75 | Exceptional 10.1% |
| Immigrants | Chile | 99.4 /100 | #76 | Exceptional 10.1% |
| Mongolians | 99.4 /100 | #77 | Exceptional 10.1% |
| Jordanians | 99.3 /100 | #78 | Exceptional 10.1% |
| Immigrants | Vietnam | 99.3 /100 | #79 | Exceptional 10.1% |
| Immigrants | Croatia | 99.3 /100 | #80 | Exceptional 10.2% |
| Latvians | 99.2 /100 | #81 | Exceptional 10.2% |
| Russians | 99.2 /100 | #82 | Exceptional 10.2% |
Demographics Similar to Luxembourgers by Disability Age 35 to 64
In terms of disability age 35 to 64, the demographic groups most similar to Luxembourgers are Vietnamese (10.6%, a difference of 0.020%), Immigrants from Moldova (10.6%, a difference of 0.050%), Immigrants from South Eastern Asia (10.6%, a difference of 0.14%), Romanian (10.6%, a difference of 0.19%), and Immigrants from Norway (10.6%, a difference of 0.22%).
| Demographics | Rating | Rank | Disability Age 35 to 64 |
| Assyrians/Chaldeans/Syriacs | 96.8 /100 | #112 | Exceptional 10.5% |
| Tongans | 96.6 /100 | #113 | Exceptional 10.5% |
| Immigrants | Morocco | 96.6 /100 | #114 | Exceptional 10.5% |
| Immigrants | Netherlands | 96.3 /100 | #115 | Exceptional 10.5% |
| Immigrants | Nepal | 95.9 /100 | #116 | Exceptional 10.6% |
| Immigrants | South Eastern Asia | 95.7 /100 | #117 | Exceptional 10.6% |
| Immigrants | Moldova | 95.5 /100 | #118 | Exceptional 10.6% |
| Luxembourgers | 95.5 /100 | #119 | Exceptional 10.6% |
| Vietnamese | 95.4 /100 | #120 | Exceptional 10.6% |
| Romanians | 95.0 /100 | #121 | Exceptional 10.6% |
| Immigrants | Norway | 95.0 /100 | #122 | Exceptional 10.6% |
| Maltese | 94.8 /100 | #123 | Exceptional 10.6% |
| Estonians | 94.5 /100 | #124 | Exceptional 10.6% |
| Albanians | 94.2 /100 | #125 | Exceptional 10.6% |
| Immigrants | Afghanistan | 94.1 /100 | #126 | Exceptional 10.6% |