Immigrants from Hong Kong vs Subsaharan African Median Male Earnings
COMPARE
Immigrants from Hong Kong
Subsaharan African
Median Male Earnings
Median Male Earnings Comparison
Immigrants from Hong Kong
Sub-Saharan Africans
$70,146
MEDIAN MALE EARNINGS
100.0/ 100
METRIC RATING
7th/ 347
METRIC RANK
$50,408
MEDIAN MALE EARNINGS
1.8/ 100
METRIC RATING
247th/ 347
METRIC RANK
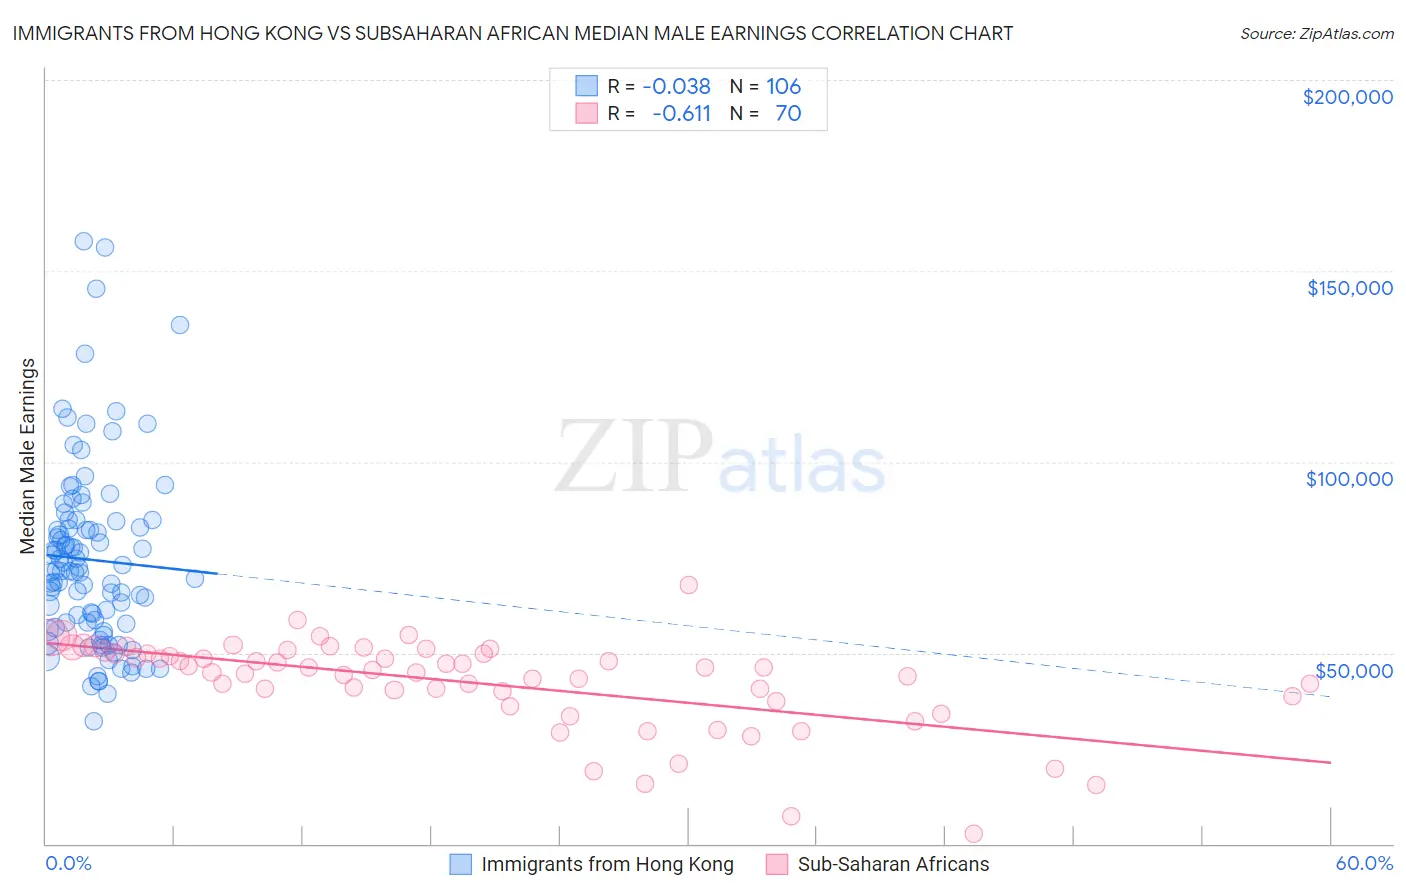
Immigrants from Hong Kong vs Subsaharan African Median Male Earnings Correlation Chart
The statistical analysis conducted on geographies consisting of 253,977,205 people shows no correlation between the proportion of Immigrants from Hong Kong and median male earnings in the United States with a correlation coefficient (R) of -0.038 and weighted average of $70,146. Similarly, the statistical analysis conducted on geographies consisting of 507,818,984 people shows a significant negative correlation between the proportion of Sub-Saharan Africans and median male earnings in the United States with a correlation coefficient (R) of -0.611 and weighted average of $50,408, a difference of 39.2%.
Median Male Earnings Correlation Summary
| Measurement | Immigrants from Hong Kong | Subsaharan African |
| Minimum | $31,993 | $2,499 |
| Maximum | $157,888 | $67,727 |
| Range | $125,895 | $65,228 |
| Mean | $74,359 | $42,175 |
| Median | $71,506 | $45,761 |
| Interquartile 25% (IQ1) | $57,587 | $38,471 |
| Interquartile 75% (IQ3) | $84,451 | $49,902 |
| Interquartile Range (IQR) | $26,864 | $11,431 |
| Standard Deviation (Sample) | $24,045 | $12,034 |
| Standard Deviation (Population) | $23,931 | $11,948 |
Similar Demographics by Median Male Earnings
Demographics Similar to Immigrants from Hong Kong by Median Male Earnings
In terms of median male earnings, the demographic groups most similar to Immigrants from Hong Kong are Iranian ($70,648, a difference of 0.72%), Immigrants from Iran ($69,284, a difference of 1.2%), Immigrants from Singapore ($71,348, a difference of 1.7%), Immigrants from South Central Asia ($68,960, a difference of 1.7%), and Immigrants from Israel ($68,716, a difference of 2.1%).
| Demographics | Rating | Rank | Median Male Earnings |
| Filipinos | 100.0 /100 | #1 | Exceptional $74,224 |
| Immigrants | India | 100.0 /100 | #2 | Exceptional $74,207 |
| Immigrants | Taiwan | 100.0 /100 | #3 | Exceptional $74,031 |
| Thais | 100.0 /100 | #4 | Exceptional $72,135 |
| Immigrants | Singapore | 100.0 /100 | #5 | Exceptional $71,348 |
| Iranians | 100.0 /100 | #6 | Exceptional $70,648 |
| Immigrants | Hong Kong | 100.0 /100 | #7 | Exceptional $70,146 |
| Immigrants | Iran | 100.0 /100 | #8 | Exceptional $69,284 |
| Immigrants | South Central Asia | 100.0 /100 | #9 | Exceptional $68,960 |
| Immigrants | Israel | 100.0 /100 | #10 | Exceptional $68,716 |
| Immigrants | Ireland | 100.0 /100 | #11 | Exceptional $67,698 |
| Immigrants | Australia | 100.0 /100 | #12 | Exceptional $67,634 |
| Immigrants | China | 100.0 /100 | #13 | Exceptional $67,353 |
| Okinawans | 100.0 /100 | #14 | Exceptional $67,232 |
| Immigrants | Eastern Asia | 100.0 /100 | #15 | Exceptional $66,903 |
Demographics Similar to Sub-Saharan Africans by Median Male Earnings
In terms of median male earnings, the demographic groups most similar to Sub-Saharan Africans are Immigrants from Ecuador ($50,474, a difference of 0.13%), Hawaiian ($50,488, a difference of 0.16%), Immigrants from Guyana ($50,321, a difference of 0.17%), Immigrants from Burma/Myanmar ($50,298, a difference of 0.22%), and Osage ($50,292, a difference of 0.23%).
| Demographics | Rating | Rank | Median Male Earnings |
| West Indians | 2.3 /100 | #240 | Tragic $50,682 |
| Immigrants | St. Vincent and the Grenadines | 2.3 /100 | #241 | Tragic $50,665 |
| Guyanese | 2.2 /100 | #242 | Tragic $50,613 |
| French American Indians | 2.2 /100 | #243 | Tragic $50,611 |
| Houma | 2.0 /100 | #244 | Tragic $50,547 |
| Hawaiians | 1.9 /100 | #245 | Tragic $50,488 |
| Immigrants | Ecuador | 1.9 /100 | #246 | Tragic $50,474 |
| Sub-Saharan Africans | 1.8 /100 | #247 | Tragic $50,408 |
| Immigrants | Guyana | 1.6 /100 | #248 | Tragic $50,321 |
| Immigrants | Burma/Myanmar | 1.6 /100 | #249 | Tragic $50,298 |
| Osage | 1.6 /100 | #250 | Tragic $50,292 |
| Immigrants | Grenada | 1.6 /100 | #251 | Tragic $50,279 |
| Immigrants | Cabo Verde | 1.2 /100 | #252 | Tragic $50,009 |
| German Russians | 1.1 /100 | #253 | Tragic $49,924 |
| Senegalese | 1.0 /100 | #254 | Tragic $49,774 |