Immigrants from Latin America vs Nicaraguan Single Father Households
COMPARE
Immigrants from Latin America
Nicaraguan
Single Father Households
Single Father Households Comparison
Immigrants from Latin America
Nicaraguans
2.8%
SINGLE FATHER HOUSEHOLDS
0.0/ 100
METRIC RATING
301st/ 347
METRIC RANK
2.6%
SINGLE FATHER HOUSEHOLDS
0.1/ 100
METRIC RATING
281st/ 347
METRIC RANK
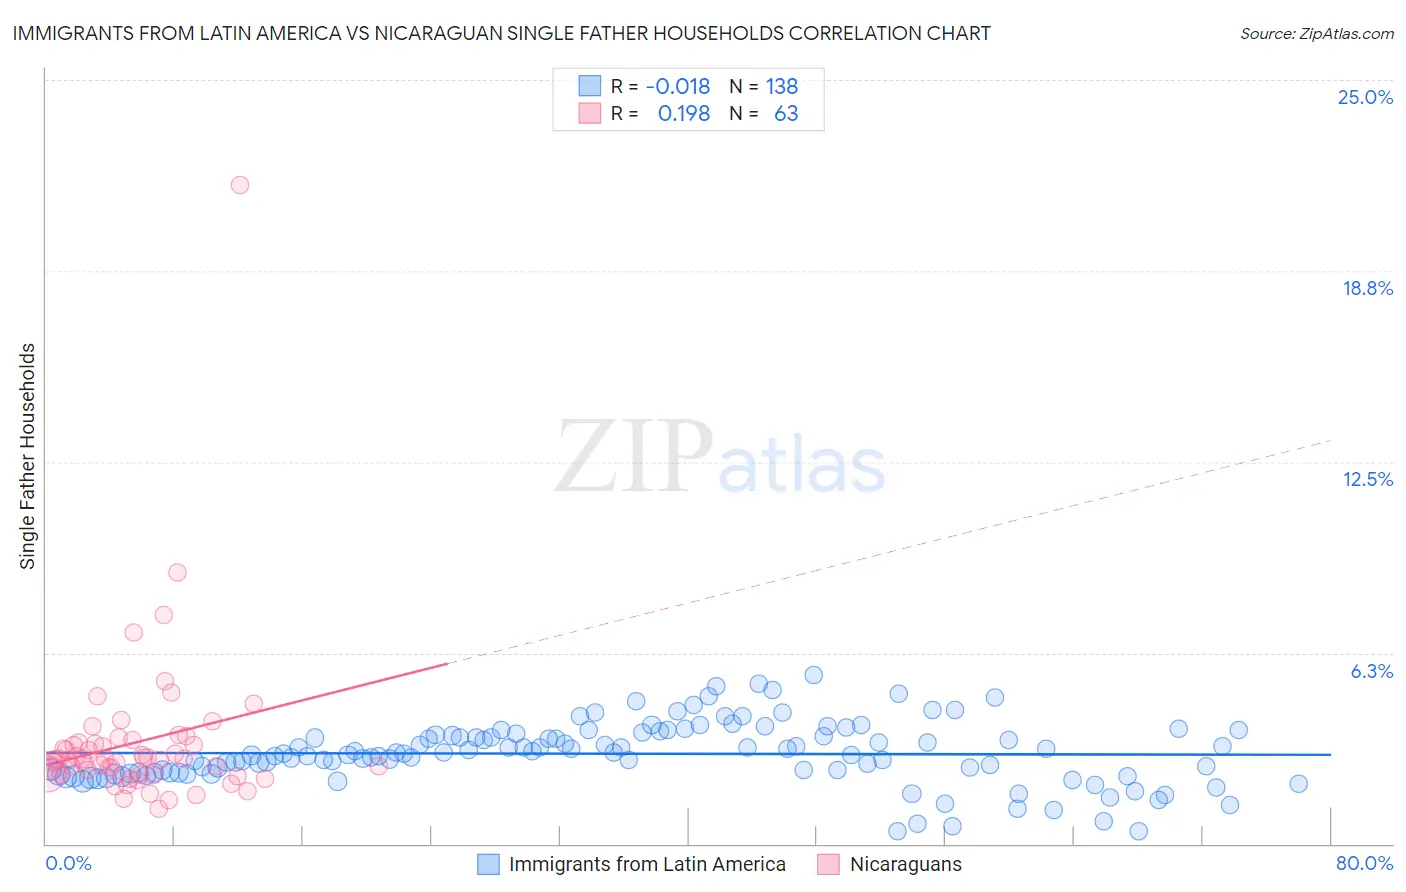
Immigrants from Latin America vs Nicaraguan Single Father Households Correlation Chart
The statistical analysis conducted on geographies consisting of 546,005,713 people shows no correlation between the proportion of Immigrants from Latin America and percentage of single father households in the United States with a correlation coefficient (R) of -0.018 and weighted average of 2.8%. Similarly, the statistical analysis conducted on geographies consisting of 284,673,398 people shows a poor positive correlation between the proportion of Nicaraguans and percentage of single father households in the United States with a correlation coefficient (R) of 0.198 and weighted average of 2.6%, a difference of 5.8%.
Single Father Households Correlation Summary
| Measurement | Immigrants from Latin America | Nicaraguan |
| Minimum | 0.41% | 1.1% |
| Maximum | 5.5% | 21.5% |
| Range | 5.1% | 20.4% |
| Mean | 2.9% | 3.3% |
| Median | 2.9% | 2.8% |
| Interquartile 25% (IQ1) | 2.3% | 2.3% |
| Interquartile 75% (IQ3) | 3.5% | 3.3% |
| Interquartile Range (IQR) | 1.2% | 1.0% |
| Standard Deviation (Sample) | 1.00% | 2.7% |
| Standard Deviation (Population) | 0.99% | 2.7% |
Demographics Similar to Immigrants from Latin America and Nicaraguans by Single Father Households
In terms of single father households, the demographic groups most similar to Immigrants from Latin America are Kiowa (2.8%, a difference of 0.050%), Lumbee (2.8%, a difference of 0.45%), Cree (2.8%, a difference of 0.83%), Honduran (2.8%, a difference of 1.3%), and Japanese (2.8%, a difference of 1.4%). Similarly, the demographic groups most similar to Nicaraguans are Dutch West Indian (2.6%, a difference of 0.050%), Immigrants from Nicaragua (2.7%, a difference of 0.75%), Hawaiian (2.7%, a difference of 0.80%), Ottawa (2.7%, a difference of 0.89%), and Immigrants from Cuba (2.7%, a difference of 0.90%).
| Demographics | Rating | Rank | Single Father Households |
| Nicaraguans | 0.1 /100 | #281 | Tragic 2.6% |
| Dutch West Indians | 0.1 /100 | #282 | Tragic 2.6% |
| Immigrants | Nicaragua | 0.1 /100 | #283 | Tragic 2.7% |
| Hawaiians | 0.1 /100 | #284 | Tragic 2.7% |
| Ottawa | 0.1 /100 | #285 | Tragic 2.7% |
| Immigrants | Cuba | 0.1 /100 | #286 | Tragic 2.7% |
| Central American Indians | 0.0 /100 | #287 | Tragic 2.7% |
| Immigrants | Cambodia | 0.0 /100 | #288 | Tragic 2.7% |
| Tlingit-Haida | 0.0 /100 | #289 | Tragic 2.7% |
| Puget Sound Salish | 0.0 /100 | #290 | Tragic 2.7% |
| Blackfeet | 0.0 /100 | #291 | Tragic 2.7% |
| Choctaw | 0.0 /100 | #292 | Tragic 2.7% |
| Immigrants | Fiji | 0.0 /100 | #293 | Tragic 2.7% |
| Malaysians | 0.0 /100 | #294 | Tragic 2.7% |
| Chickasaw | 0.0 /100 | #295 | Tragic 2.8% |
| Japanese | 0.0 /100 | #296 | Tragic 2.8% |
| Hondurans | 0.0 /100 | #297 | Tragic 2.8% |
| Cree | 0.0 /100 | #298 | Tragic 2.8% |
| Lumbee | 0.0 /100 | #299 | Tragic 2.8% |
| Kiowa | 0.0 /100 | #300 | Tragic 2.8% |
| Immigrants | Latin America | 0.0 /100 | #301 | Tragic 2.8% |