Immigrants from Latin America vs French American Indian Child Poverty Among Boys Under 16
COMPARE
Immigrants from Latin America
French American Indian
Child Poverty Among Boys Under 16
Child Poverty Among Boys Under 16 Comparison
Immigrants from Latin America
French American Indians
20.6%
CHILD POVERTY AMONG BOYS UNDER 16
0.0/ 100
METRIC RATING
291st/ 347
METRIC RANK
19.2%
CHILD POVERTY AMONG BOYS UNDER 16
0.2/ 100
METRIC RATING
251st/ 347
METRIC RANK
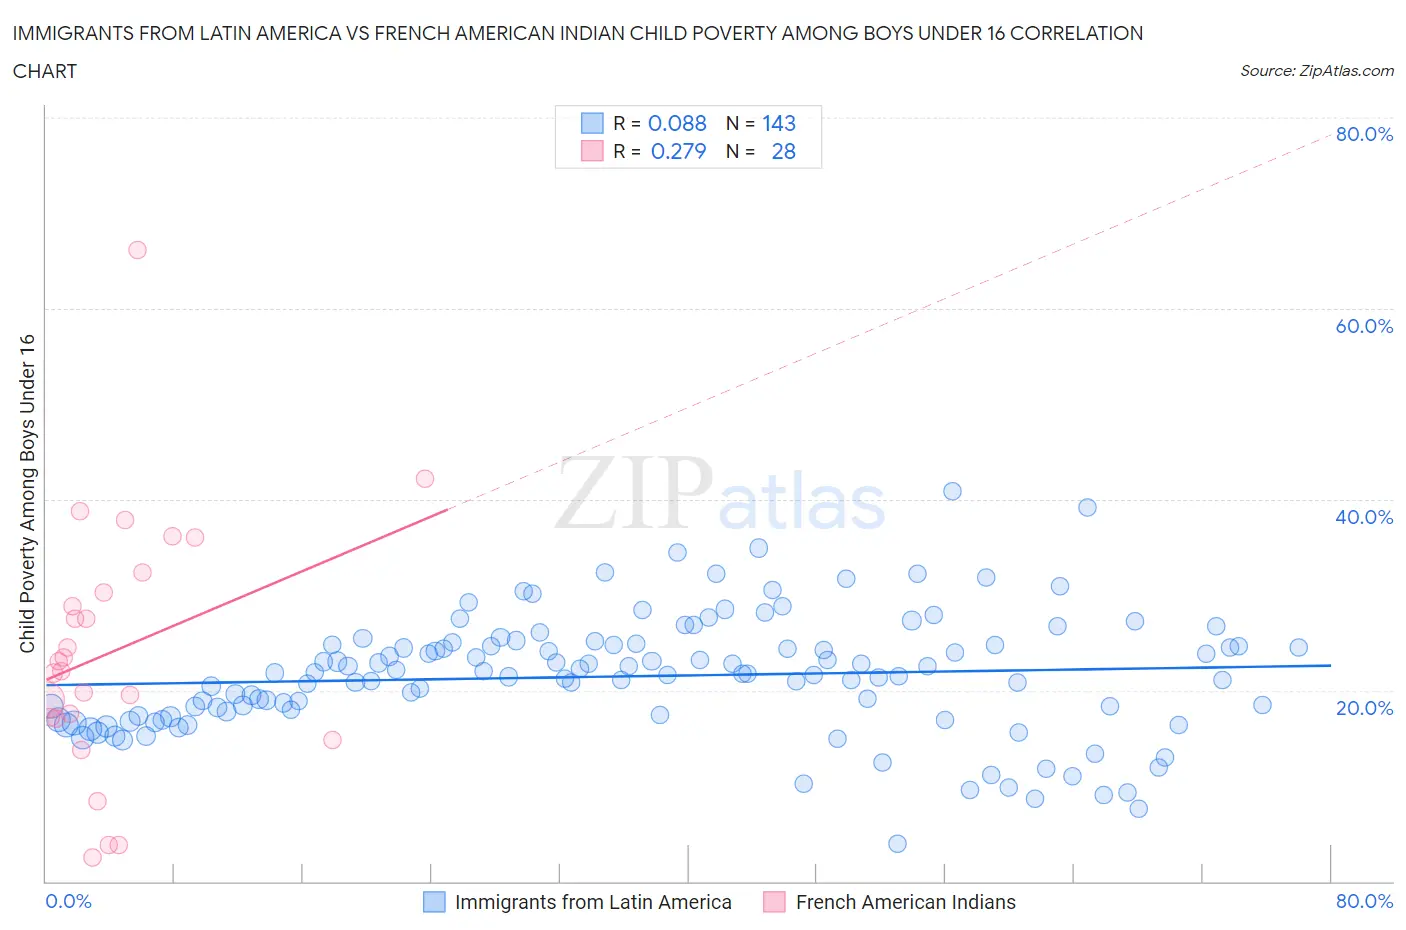
Immigrants from Latin America vs French American Indian Child Poverty Among Boys Under 16 Correlation Chart
The statistical analysis conducted on geographies consisting of 541,398,754 people shows a slight positive correlation between the proportion of Immigrants from Latin America and poverty level among boys under the age of 16 in the United States with a correlation coefficient (R) of 0.088 and weighted average of 20.6%. Similarly, the statistical analysis conducted on geographies consisting of 131,081,352 people shows a weak positive correlation between the proportion of French American Indians and poverty level among boys under the age of 16 in the United States with a correlation coefficient (R) of 0.279 and weighted average of 19.2%, a difference of 7.4%.
Child Poverty Among Boys Under 16 Correlation Summary
| Measurement | Immigrants from Latin America | French American Indian |
| Minimum | 3.9% | 2.5% |
| Maximum | 40.9% | 66.1% |
| Range | 37.0% | 63.6% |
| Mean | 21.5% | 24.1% |
| Median | 21.7% | 22.5% |
| Interquartile 25% (IQ1) | 17.3% | 17.1% |
| Interquartile 75% (IQ3) | 24.7% | 31.3% |
| Interquartile Range (IQR) | 7.4% | 14.2% |
| Standard Deviation (Sample) | 6.2% | 13.4% |
| Standard Deviation (Population) | 6.2% | 13.2% |
Similar Demographics by Child Poverty Among Boys Under 16
Demographics Similar to Immigrants from Latin America by Child Poverty Among Boys Under 16
In terms of child poverty among boys under 16, the demographic groups most similar to Immigrants from Latin America are Yaqui (20.7%, a difference of 0.26%), Immigrants from Senegal (20.7%, a difference of 0.27%), Immigrants from Bahamas (20.7%, a difference of 0.39%), Senegalese (20.6%, a difference of 0.44%), and Mexican (20.7%, a difference of 0.52%).
| Demographics | Rating | Rank | Child Poverty Among Boys Under 16 |
| Barbadians | 0.0 /100 | #284 | Tragic 20.2% |
| Arapaho | 0.0 /100 | #285 | Tragic 20.2% |
| West Indians | 0.0 /100 | #286 | Tragic 20.3% |
| Immigrants | Belize | 0.0 /100 | #287 | Tragic 20.3% |
| Immigrants | St. Vincent and the Grenadines | 0.0 /100 | #288 | Tragic 20.3% |
| Blackfeet | 0.0 /100 | #289 | Tragic 20.4% |
| Senegalese | 0.0 /100 | #290 | Tragic 20.6% |
| Immigrants | Latin America | 0.0 /100 | #291 | Tragic 20.6% |
| Yaqui | 0.0 /100 | #292 | Tragic 20.7% |
| Immigrants | Senegal | 0.0 /100 | #293 | Tragic 20.7% |
| Immigrants | Bahamas | 0.0 /100 | #294 | Tragic 20.7% |
| Mexicans | 0.0 /100 | #295 | Tragic 20.7% |
| Indonesians | 0.0 /100 | #296 | Tragic 20.8% |
| Hispanics or Latinos | 0.0 /100 | #297 | Tragic 20.9% |
| Chippewa | 0.0 /100 | #298 | Tragic 21.0% |
Demographics Similar to French American Indians by Child Poverty Among Boys Under 16
In terms of child poverty among boys under 16, the demographic groups most similar to French American Indians are Immigrants from Burma/Myanmar (19.2%, a difference of 0.030%), Immigrants from Western Africa (19.3%, a difference of 0.23%), Liberian (19.3%, a difference of 0.30%), Trinidadian and Tobagonian (19.3%, a difference of 0.57%), and Ecuadorian (19.3%, a difference of 0.57%).
| Demographics | Rating | Rank | Child Poverty Among Boys Under 16 |
| Immigrants | Middle Africa | 0.4 /100 | #244 | Tragic 18.9% |
| Cree | 0.4 /100 | #245 | Tragic 19.0% |
| Immigrants | Nicaragua | 0.4 /100 | #246 | Tragic 19.0% |
| Immigrants | Trinidad and Tobago | 0.3 /100 | #247 | Tragic 19.0% |
| Salvadorans | 0.3 /100 | #248 | Tragic 19.0% |
| Alsatians | 0.3 /100 | #249 | Tragic 19.1% |
| Immigrants | Burma/Myanmar | 0.2 /100 | #250 | Tragic 19.2% |
| French American Indians | 0.2 /100 | #251 | Tragic 19.2% |
| Immigrants | Western Africa | 0.2 /100 | #252 | Tragic 19.3% |
| Liberians | 0.2 /100 | #253 | Tragic 19.3% |
| Trinidadians and Tobagonians | 0.2 /100 | #254 | Tragic 19.3% |
| Ecuadorians | 0.2 /100 | #255 | Tragic 19.3% |
| Immigrants | Liberia | 0.2 /100 | #256 | Tragic 19.3% |
| Mexican American Indians | 0.2 /100 | #257 | Tragic 19.4% |
| Potawatomi | 0.2 /100 | #258 | Tragic 19.4% |