Immigrants from Kuwait vs Cuban Per Capita Income
COMPARE
Immigrants from Kuwait
Cuban
Per Capita Income
Per Capita Income Comparison
Immigrants from Kuwait
Cubans
$46,543
PER CAPITA INCOME
96.2/ 100
METRIC RATING
108th/ 347
METRIC RANK
$37,383
PER CAPITA INCOME
0.1/ 100
METRIC RATING
294th/ 347
METRIC RANK
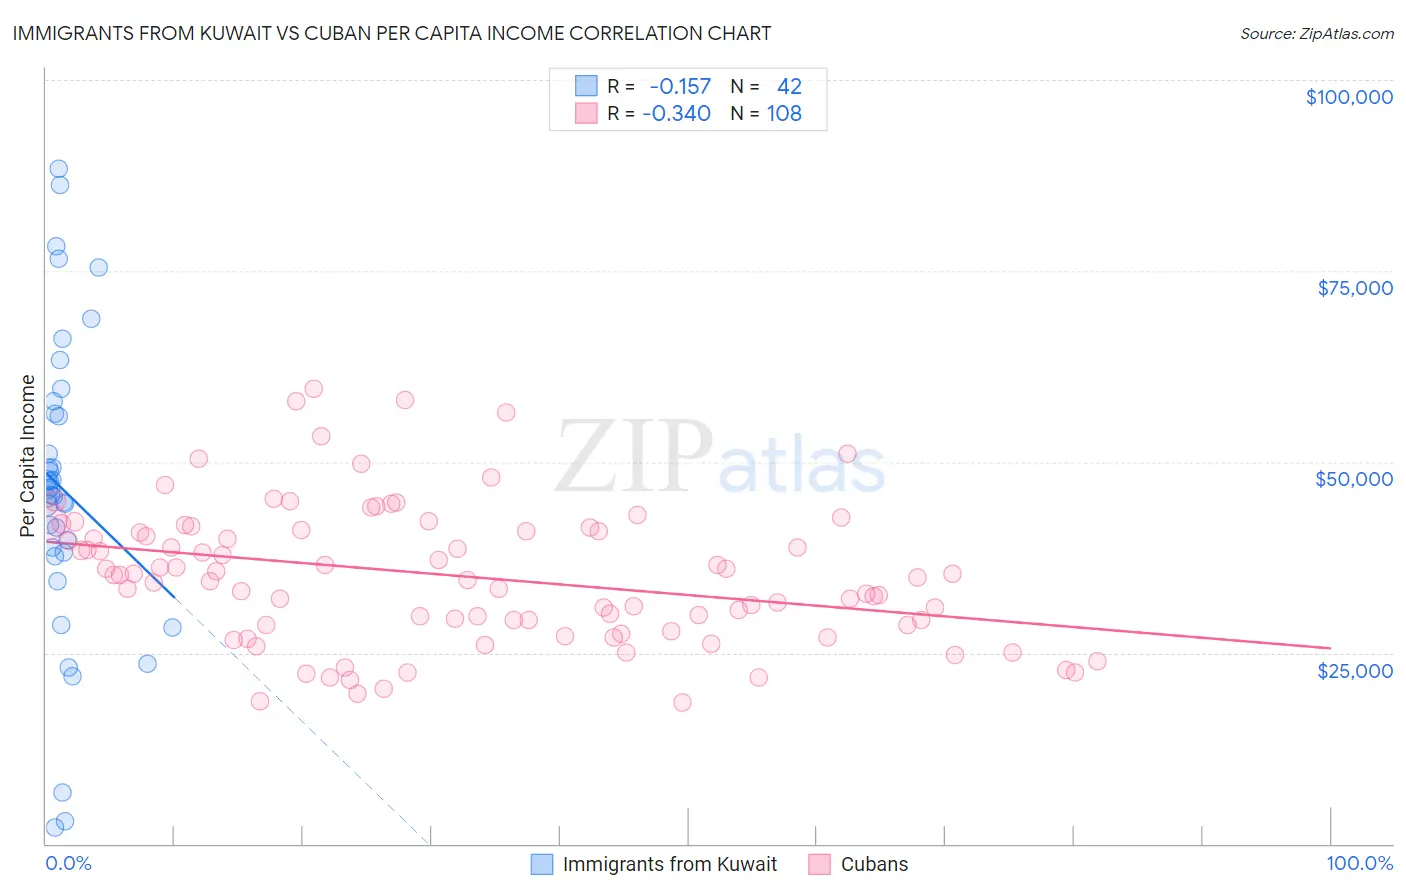
Immigrants from Kuwait vs Cuban Per Capita Income Correlation Chart
The statistical analysis conducted on geographies consisting of 136,913,885 people shows a poor negative correlation between the proportion of Immigrants from Kuwait and per capita income in the United States with a correlation coefficient (R) of -0.157 and weighted average of $46,543. Similarly, the statistical analysis conducted on geographies consisting of 449,330,794 people shows a mild negative correlation between the proportion of Cubans and per capita income in the United States with a correlation coefficient (R) of -0.340 and weighted average of $37,383, a difference of 24.5%.
Per Capita Income Correlation Summary
| Measurement | Immigrants from Kuwait | Cuban |
| Minimum | $2,068 | $18,566 |
| Maximum | $88,433 | $59,513 |
| Range | $86,365 | $40,947 |
| Mean | $46,335 | $35,073 |
| Median | $46,027 | $35,004 |
| Interquartile 25% (IQ1) | $38,209 | $28,628 |
| Interquartile 75% (IQ3) | $56,277 | $40,960 |
| Interquartile Range (IQR) | $18,068 | $12,332 |
| Standard Deviation (Sample) | $19,760 | $9,056 |
| Standard Deviation (Population) | $19,524 | $9,014 |
Similar Demographics by Per Capita Income
Demographics Similar to Immigrants from Kuwait by Per Capita Income
In terms of per capita income, the demographic groups most similar to Immigrants from Kuwait are Serbian ($46,551, a difference of 0.020%), Immigrants from Northern Africa ($46,531, a difference of 0.030%), British ($46,571, a difference of 0.060%), Ethiopian ($46,569, a difference of 0.060%), and Chilean ($46,459, a difference of 0.18%).
| Demographics | Rating | Rank | Per Capita Income |
| Immigrants | Uzbekistan | 97.5 /100 | #101 | Exceptional $46,929 |
| Immigrants | Western Asia | 97.4 /100 | #102 | Exceptional $46,876 |
| Syrians | 97.2 /100 | #103 | Exceptional $46,837 |
| Brazilians | 96.8 /100 | #104 | Exceptional $46,700 |
| British | 96.3 /100 | #105 | Exceptional $46,571 |
| Ethiopians | 96.3 /100 | #106 | Exceptional $46,569 |
| Serbians | 96.2 /100 | #107 | Exceptional $46,551 |
| Immigrants | Kuwait | 96.2 /100 | #108 | Exceptional $46,543 |
| Immigrants | Northern Africa | 96.2 /100 | #109 | Exceptional $46,531 |
| Chileans | 95.9 /100 | #110 | Exceptional $46,459 |
| Taiwanese | 95.8 /100 | #111 | Exceptional $46,455 |
| Immigrants | Morocco | 95.7 /100 | #112 | Exceptional $46,430 |
| Immigrants | Albania | 95.5 /100 | #113 | Exceptional $46,387 |
| Afghans | 94.9 /100 | #114 | Exceptional $46,268 |
| Immigrants | Chile | 94.6 /100 | #115 | Exceptional $46,213 |
Demographics Similar to Cubans by Per Capita Income
In terms of per capita income, the demographic groups most similar to Cubans are Mexican American Indian ($37,407, a difference of 0.070%), Immigrants from Dominican Republic ($37,306, a difference of 0.21%), Immigrants from Micronesia ($37,464, a difference of 0.22%), Indonesian ($37,300, a difference of 0.22%), and Haitian ($37,289, a difference of 0.25%).
| Demographics | Rating | Rank | Per Capita Income |
| Dominicans | 0.1 /100 | #287 | Tragic $37,697 |
| Blackfeet | 0.1 /100 | #288 | Tragic $37,695 |
| U.S. Virgin Islanders | 0.1 /100 | #289 | Tragic $37,589 |
| Immigrants | Guatemala | 0.1 /100 | #290 | Tragic $37,550 |
| Cajuns | 0.1 /100 | #291 | Tragic $37,527 |
| Immigrants | Micronesia | 0.1 /100 | #292 | Tragic $37,464 |
| Mexican American Indians | 0.1 /100 | #293 | Tragic $37,407 |
| Cubans | 0.1 /100 | #294 | Tragic $37,383 |
| Immigrants | Dominican Republic | 0.1 /100 | #295 | Tragic $37,306 |
| Indonesians | 0.1 /100 | #296 | Tragic $37,300 |
| Haitians | 0.1 /100 | #297 | Tragic $37,289 |
| Immigrants | Caribbean | 0.1 /100 | #298 | Tragic $37,254 |
| Cherokee | 0.1 /100 | #299 | Tragic $37,203 |
| Immigrants | Bahamas | 0.1 /100 | #300 | Tragic $37,193 |
| Ottawa | 0.1 /100 | #301 | Tragic $37,101 |