Immigrants from Jordan vs Immigrants from Uganda Householder Income Ages 25 - 44 years
COMPARE
Immigrants from Jordan
Immigrants from Uganda
Householder Income Ages 25 - 44 years
Householder Income Ages 25 - 44 years Comparison
Immigrants from Jordan
Immigrants from Uganda
$97,185
HOUSEHOLDER INCOME AGES 25 - 44 YEARS
81.0/ 100
METRIC RATING
143rd/ 347
METRIC RANK
$95,698
HOUSEHOLDER INCOME AGES 25 - 44 YEARS
65.2/ 100
METRIC RATING
157th/ 347
METRIC RANK
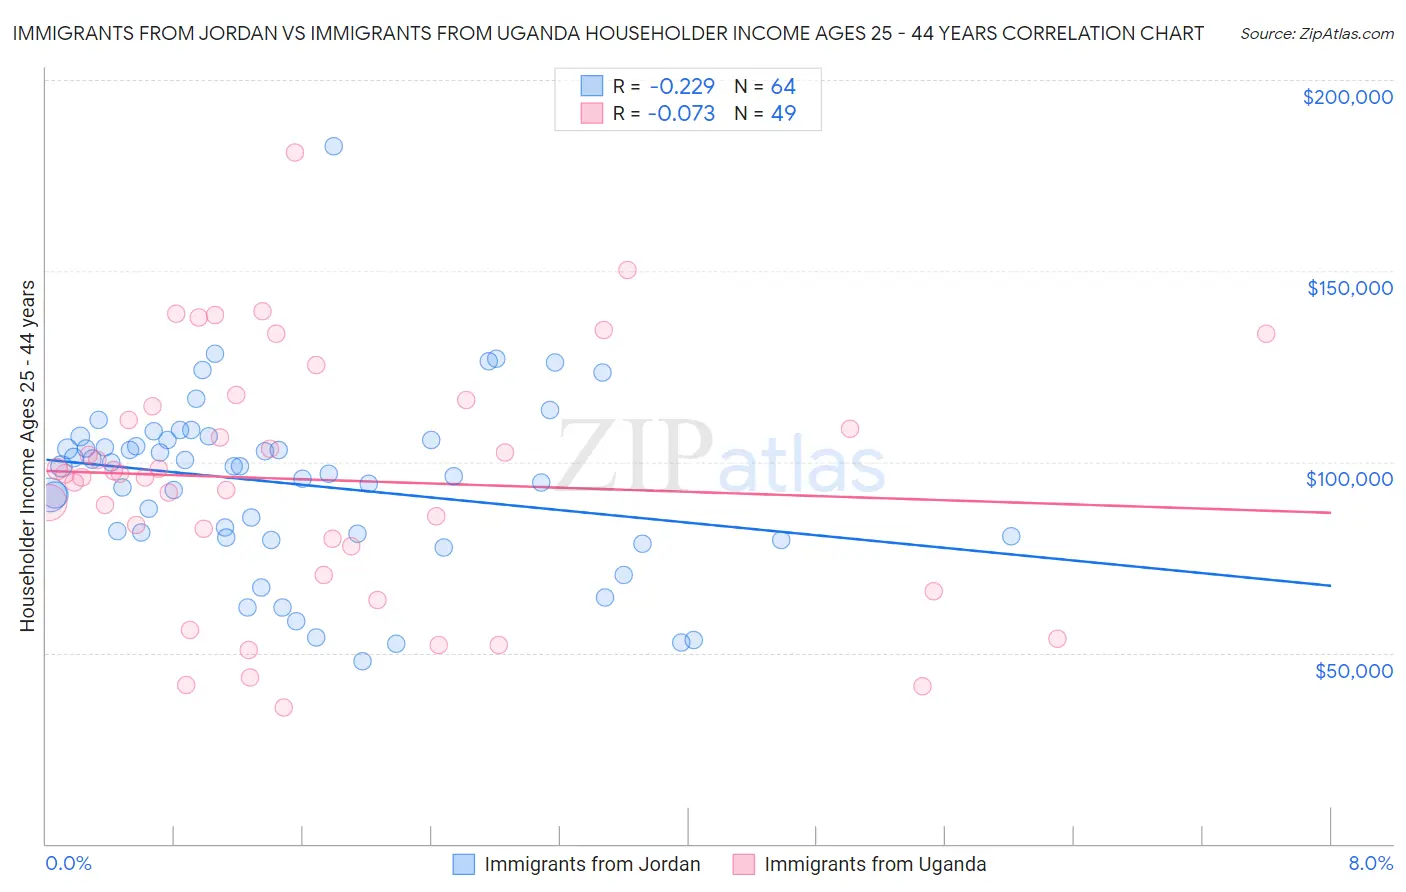
Immigrants from Jordan vs Immigrants from Uganda Householder Income Ages 25 - 44 years Correlation Chart
The statistical analysis conducted on geographies consisting of 181,164,204 people shows a weak negative correlation between the proportion of Immigrants from Jordan and household income with householder between the ages 25 and 44 in the United States with a correlation coefficient (R) of -0.229 and weighted average of $97,185. Similarly, the statistical analysis conducted on geographies consisting of 125,922,646 people shows a slight negative correlation between the proportion of Immigrants from Uganda and household income with householder between the ages 25 and 44 in the United States with a correlation coefficient (R) of -0.073 and weighted average of $95,698, a difference of 1.5%.
Householder Income Ages 25 - 44 years Correlation Summary
| Measurement | Immigrants from Jordan | Immigrants from Uganda |
| Minimum | $47,644 | $35,667 |
| Maximum | $182,512 | $180,909 |
| Range | $134,868 | $145,242 |
| Mean | $94,069 | $95,288 |
| Median | $97,769 | $96,887 |
| Interquartile 25% (IQ1) | $80,422 | $74,128 |
| Interquartile 75% (IQ3) | $105,721 | $115,286 |
| Interquartile Range (IQR) | $25,299 | $41,158 |
| Standard Deviation (Sample) | $23,095 | $32,223 |
| Standard Deviation (Population) | $22,914 | $31,892 |
Demographics Similar to Immigrants from Jordan and Immigrants from Uganda by Householder Income Ages 25 - 44 years
In terms of householder income ages 25 - 44 years, the demographic groups most similar to Immigrants from Jordan are Immigrants from Chile ($97,159, a difference of 0.030%), Danish ($97,221, a difference of 0.040%), Luxembourger ($97,237, a difference of 0.050%), Immigrants from Morocco ($97,305, a difference of 0.12%), and Norwegian ($96,866, a difference of 0.33%). Similarly, the demographic groups most similar to Immigrants from Uganda are Scandinavian ($95,596, a difference of 0.11%), Costa Rican ($95,565, a difference of 0.14%), Icelander ($95,560, a difference of 0.14%), Immigrants from Germany ($95,913, a difference of 0.22%), and Moroccan ($96,117, a difference of 0.44%).
| Demographics | Rating | Rank | Householder Income Ages 25 - 44 years |
| Immigrants | Morocco | 82.0 /100 | #140 | Excellent $97,305 |
| Luxembourgers | 81.5 /100 | #141 | Excellent $97,237 |
| Danes | 81.3 /100 | #142 | Excellent $97,221 |
| Immigrants | Jordan | 81.0 /100 | #143 | Excellent $97,185 |
| Immigrants | Chile | 80.8 /100 | #144 | Excellent $97,159 |
| Norwegians | 78.2 /100 | #145 | Good $96,866 |
| Ethiopians | 77.8 /100 | #146 | Good $96,824 |
| Immigrants | Syria | 77.4 /100 | #147 | Good $96,789 |
| Irish | 76.9 /100 | #148 | Good $96,730 |
| Basques | 76.6 /100 | #149 | Good $96,709 |
| Ugandans | 76.2 /100 | #150 | Good $96,667 |
| Czechs | 74.8 /100 | #151 | Good $96,525 |
| South American Indians | 74.5 /100 | #152 | Good $96,497 |
| Slovenes | 73.9 /100 | #153 | Good $96,439 |
| Slavs | 73.2 /100 | #154 | Good $96,377 |
| Moroccans | 70.3 /100 | #155 | Good $96,117 |
| Immigrants | Germany | 67.9 /100 | #156 | Good $95,913 |
| Immigrants | Uganda | 65.2 /100 | #157 | Good $95,698 |
| Scandinavians | 63.9 /100 | #158 | Good $95,596 |
| Costa Ricans | 63.5 /100 | #159 | Good $95,565 |
| Icelanders | 63.4 /100 | #160 | Good $95,560 |