Immigrants from Jordan vs Immigrants from Nicaragua Householder Income Ages 25 - 44 years
COMPARE
Immigrants from Jordan
Immigrants from Nicaragua
Householder Income Ages 25 - 44 years
Householder Income Ages 25 - 44 years Comparison
Immigrants from Jordan
Immigrants from Nicaragua
$97,185
HOUSEHOLDER INCOME AGES 25 - 44 YEARS
81.0/ 100
METRIC RATING
143rd/ 347
METRIC RANK
$84,914
HOUSEHOLDER INCOME AGES 25 - 44 YEARS
0.5/ 100
METRIC RATING
258th/ 347
METRIC RANK
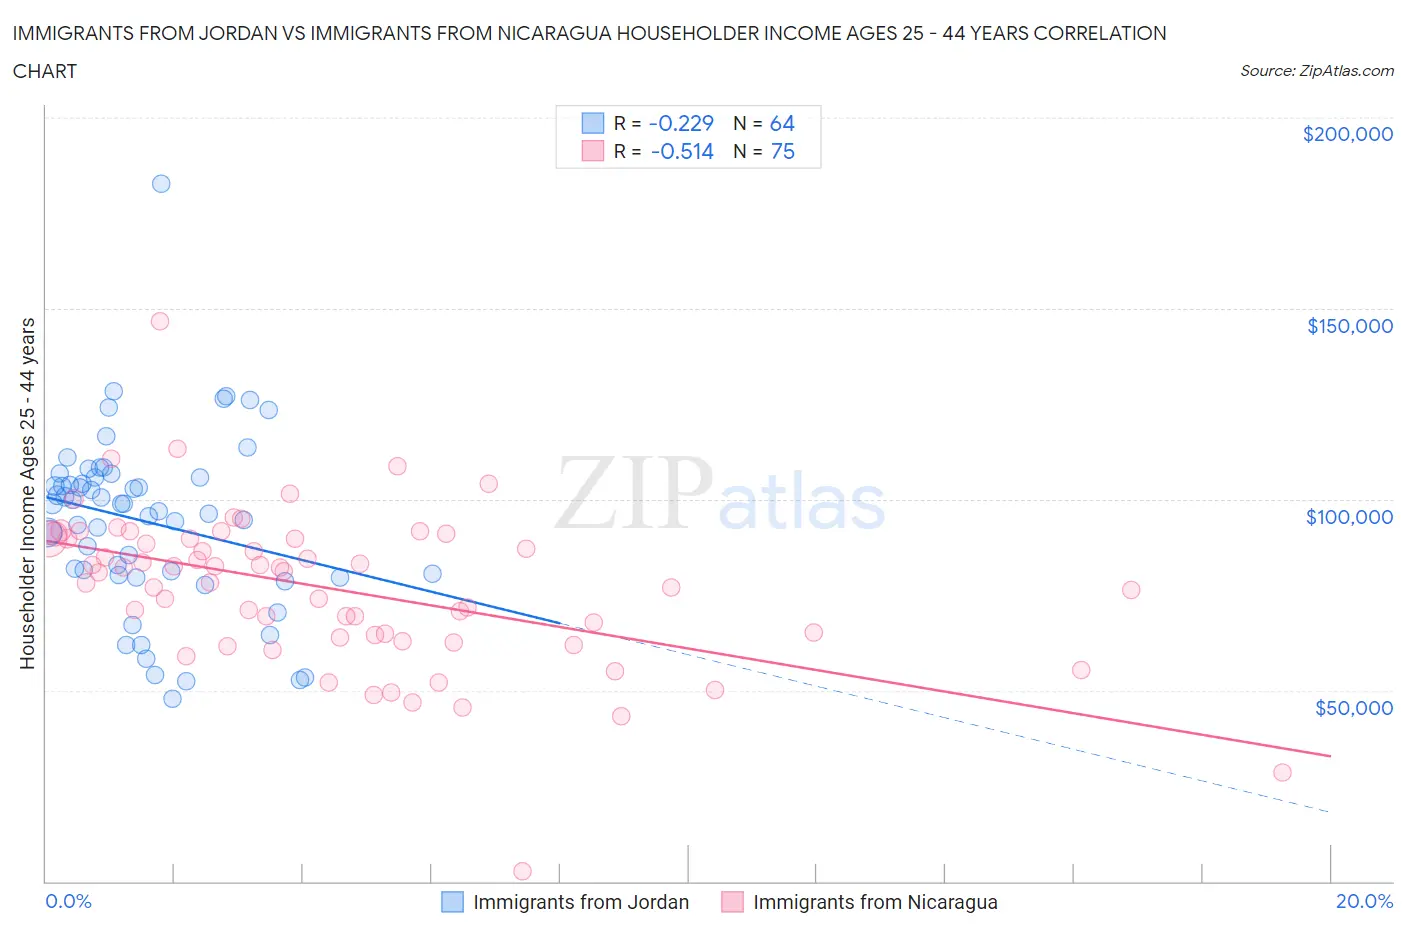
Immigrants from Jordan vs Immigrants from Nicaragua Householder Income Ages 25 - 44 years Correlation Chart
The statistical analysis conducted on geographies consisting of 181,164,204 people shows a weak negative correlation between the proportion of Immigrants from Jordan and household income with householder between the ages 25 and 44 in the United States with a correlation coefficient (R) of -0.229 and weighted average of $97,185. Similarly, the statistical analysis conducted on geographies consisting of 236,220,406 people shows a substantial negative correlation between the proportion of Immigrants from Nicaragua and household income with householder between the ages 25 and 44 in the United States with a correlation coefficient (R) of -0.514 and weighted average of $84,914, a difference of 14.4%.
Householder Income Ages 25 - 44 years Correlation Summary
| Measurement | Immigrants from Jordan | Immigrants from Nicaragua |
| Minimum | $47,644 | $2,499 |
| Maximum | $182,512 | $146,625 |
| Range | $134,868 | $144,126 |
| Mean | $94,069 | $76,575 |
| Median | $97,769 | $80,789 |
| Interquartile 25% (IQ1) | $80,422 | $63,671 |
| Interquartile 75% (IQ3) | $105,721 | $89,720 |
| Interquartile Range (IQR) | $25,299 | $26,048 |
| Standard Deviation (Sample) | $23,095 | $20,803 |
| Standard Deviation (Population) | $22,914 | $20,664 |
Similar Demographics by Householder Income Ages 25 - 44 years
Demographics Similar to Immigrants from Jordan by Householder Income Ages 25 - 44 years
In terms of householder income ages 25 - 44 years, the demographic groups most similar to Immigrants from Jordan are Immigrants from Chile ($97,159, a difference of 0.030%), Danish ($97,221, a difference of 0.040%), Luxembourger ($97,237, a difference of 0.050%), Immigrants from Morocco ($97,305, a difference of 0.12%), and Immigrants from Peru ($97,329, a difference of 0.15%).
| Demographics | Rating | Rank | Householder Income Ages 25 - 44 years |
| Hungarians | 83.9 /100 | #136 | Excellent $97,544 |
| Lebanese | 82.3 /100 | #137 | Excellent $97,339 |
| Arabs | 82.3 /100 | #138 | Excellent $97,336 |
| Immigrants | Peru | 82.2 /100 | #139 | Excellent $97,329 |
| Immigrants | Morocco | 82.0 /100 | #140 | Excellent $97,305 |
| Luxembourgers | 81.5 /100 | #141 | Excellent $97,237 |
| Danes | 81.3 /100 | #142 | Excellent $97,221 |
| Immigrants | Jordan | 81.0 /100 | #143 | Excellent $97,185 |
| Immigrants | Chile | 80.8 /100 | #144 | Excellent $97,159 |
| Norwegians | 78.2 /100 | #145 | Good $96,866 |
| Ethiopians | 77.8 /100 | #146 | Good $96,824 |
| Immigrants | Syria | 77.4 /100 | #147 | Good $96,789 |
| Irish | 76.9 /100 | #148 | Good $96,730 |
| Basques | 76.6 /100 | #149 | Good $96,709 |
| Ugandans | 76.2 /100 | #150 | Good $96,667 |
Demographics Similar to Immigrants from Nicaragua by Householder Income Ages 25 - 44 years
In terms of householder income ages 25 - 44 years, the demographic groups most similar to Immigrants from Nicaragua are Immigrants from Senegal ($84,848, a difference of 0.080%), American ($84,791, a difference of 0.14%), Mexican American Indian ($85,066, a difference of 0.18%), Central American ($85,144, a difference of 0.27%), and Inupiat ($84,619, a difference of 0.35%).
| Demographics | Rating | Rank | Householder Income Ages 25 - 44 years |
| Cape Verdeans | 0.8 /100 | #251 | Tragic $85,758 |
| Immigrants | Western Africa | 0.7 /100 | #252 | Tragic $85,676 |
| British West Indians | 0.7 /100 | #253 | Tragic $85,565 |
| Immigrants | Laos | 0.7 /100 | #254 | Tragic $85,553 |
| German Russians | 0.6 /100 | #255 | Tragic $85,220 |
| Central Americans | 0.5 /100 | #256 | Tragic $85,144 |
| Mexican American Indians | 0.5 /100 | #257 | Tragic $85,066 |
| Immigrants | Nicaragua | 0.5 /100 | #258 | Tragic $84,914 |
| Immigrants | Senegal | 0.5 /100 | #259 | Tragic $84,848 |
| Americans | 0.4 /100 | #260 | Tragic $84,791 |
| Inupiat | 0.4 /100 | #261 | Tragic $84,619 |
| Cree | 0.4 /100 | #262 | Tragic $84,574 |
| Belizeans | 0.4 /100 | #263 | Tragic $84,534 |
| Osage | 0.4 /100 | #264 | Tragic $84,461 |
| Sudanese | 0.4 /100 | #265 | Tragic $84,401 |