Immigrants from Jordan vs Immigrants from Northern Africa Householder Income Ages 25 - 44 years
COMPARE
Immigrants from Jordan
Immigrants from Northern Africa
Householder Income Ages 25 - 44 years
Householder Income Ages 25 - 44 years Comparison
Immigrants from Jordan
Immigrants from Northern Africa
$97,185
HOUSEHOLDER INCOME AGES 25 - 44 YEARS
81.0/ 100
METRIC RATING
143rd/ 347
METRIC RANK
$99,232
HOUSEHOLDER INCOME AGES 25 - 44 YEARS
93.0/ 100
METRIC RATING
117th/ 347
METRIC RANK
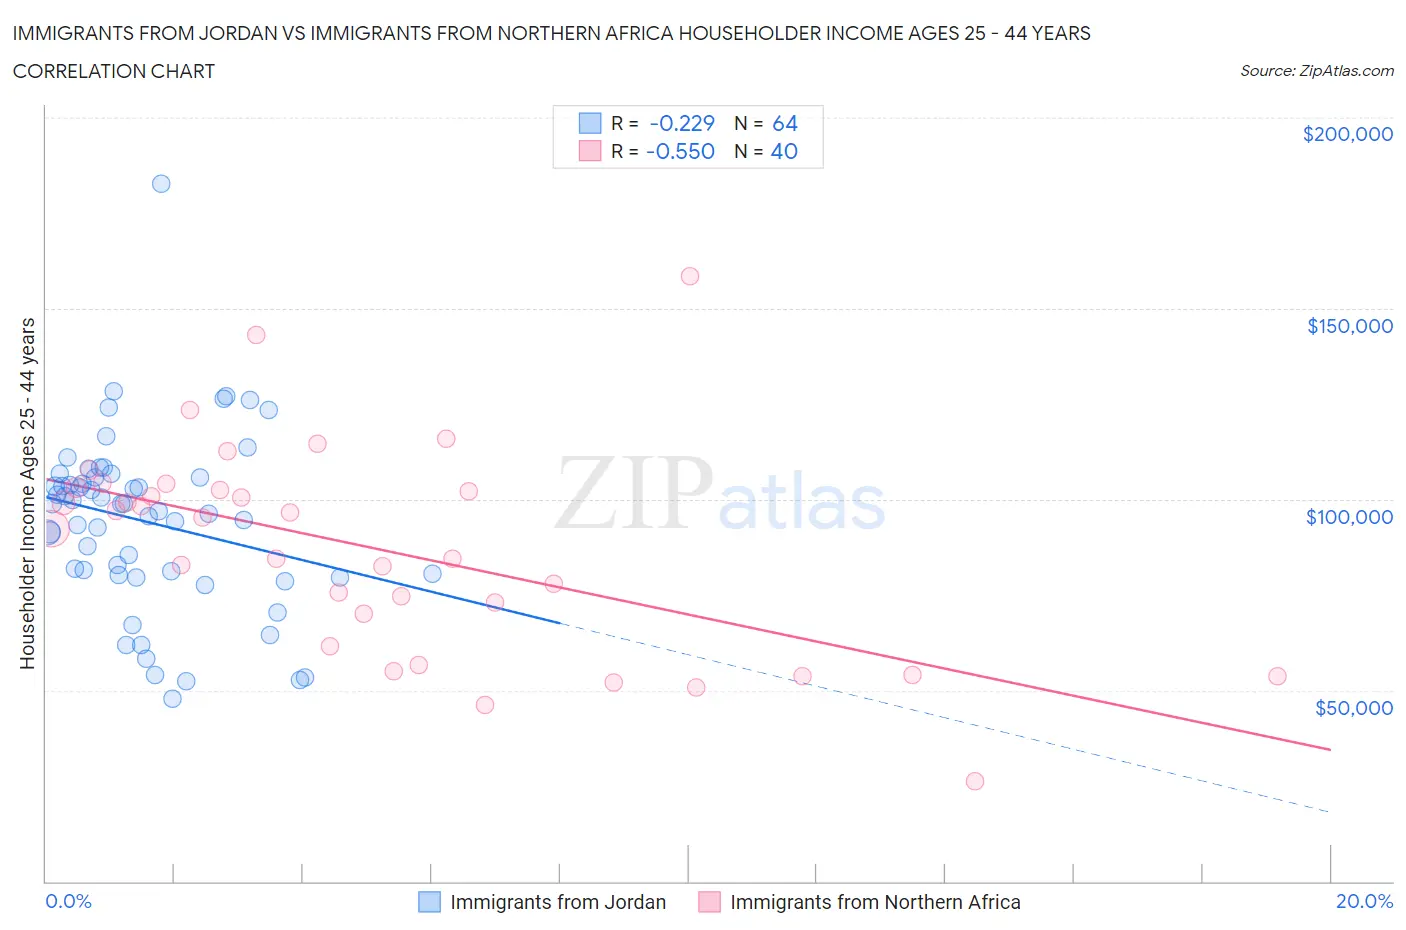
Immigrants from Jordan vs Immigrants from Northern Africa Householder Income Ages 25 - 44 years Correlation Chart
The statistical analysis conducted on geographies consisting of 181,164,204 people shows a weak negative correlation between the proportion of Immigrants from Jordan and household income with householder between the ages 25 and 44 in the United States with a correlation coefficient (R) of -0.229 and weighted average of $97,185. Similarly, the statistical analysis conducted on geographies consisting of 320,605,097 people shows a substantial negative correlation between the proportion of Immigrants from Northern Africa and household income with householder between the ages 25 and 44 in the United States with a correlation coefficient (R) of -0.550 and weighted average of $99,232, a difference of 2.1%.
Householder Income Ages 25 - 44 years Correlation Summary
| Measurement | Immigrants from Jordan | Immigrants from Northern Africa |
| Minimum | $47,644 | $26,250 |
| Maximum | $182,512 | $158,487 |
| Range | $134,868 | $132,237 |
| Mean | $94,069 | $87,149 |
| Median | $97,769 | $93,767 |
| Interquartile 25% (IQ1) | $80,422 | $65,886 |
| Interquartile 75% (IQ3) | $105,721 | $102,671 |
| Interquartile Range (IQR) | $25,299 | $36,785 |
| Standard Deviation (Sample) | $23,095 | $27,415 |
| Standard Deviation (Population) | $22,914 | $27,070 |
Similar Demographics by Householder Income Ages 25 - 44 years
Demographics Similar to Immigrants from Jordan by Householder Income Ages 25 - 44 years
In terms of householder income ages 25 - 44 years, the demographic groups most similar to Immigrants from Jordan are Immigrants from Chile ($97,159, a difference of 0.030%), Danish ($97,221, a difference of 0.040%), Luxembourger ($97,237, a difference of 0.050%), Immigrants from Morocco ($97,305, a difference of 0.12%), and Immigrants from Peru ($97,329, a difference of 0.15%).
| Demographics | Rating | Rank | Householder Income Ages 25 - 44 years |
| Hungarians | 83.9 /100 | #136 | Excellent $97,544 |
| Lebanese | 82.3 /100 | #137 | Excellent $97,339 |
| Arabs | 82.3 /100 | #138 | Excellent $97,336 |
| Immigrants | Peru | 82.2 /100 | #139 | Excellent $97,329 |
| Immigrants | Morocco | 82.0 /100 | #140 | Excellent $97,305 |
| Luxembourgers | 81.5 /100 | #141 | Excellent $97,237 |
| Danes | 81.3 /100 | #142 | Excellent $97,221 |
| Immigrants | Jordan | 81.0 /100 | #143 | Excellent $97,185 |
| Immigrants | Chile | 80.8 /100 | #144 | Excellent $97,159 |
| Norwegians | 78.2 /100 | #145 | Good $96,866 |
| Ethiopians | 77.8 /100 | #146 | Good $96,824 |
| Immigrants | Syria | 77.4 /100 | #147 | Good $96,789 |
| Irish | 76.9 /100 | #148 | Good $96,730 |
| Basques | 76.6 /100 | #149 | Good $96,709 |
| Ugandans | 76.2 /100 | #150 | Good $96,667 |
Demographics Similar to Immigrants from Northern Africa by Householder Income Ages 25 - 44 years
In terms of householder income ages 25 - 44 years, the demographic groups most similar to Immigrants from Northern Africa are Syrian ($99,215, a difference of 0.020%), Jordanian ($99,186, a difference of 0.050%), Swedish ($99,136, a difference of 0.10%), Portuguese ($99,429, a difference of 0.20%), and Carpatho Rusyn ($99,449, a difference of 0.22%).
| Demographics | Rating | Rank | Householder Income Ages 25 - 44 years |
| Immigrants | Afghanistan | 95.3 /100 | #110 | Exceptional $99,977 |
| Chileans | 95.1 /100 | #111 | Exceptional $99,900 |
| Poles | 94.5 /100 | #112 | Exceptional $99,685 |
| Tongans | 94.2 /100 | #113 | Exceptional $99,604 |
| Immigrants | Western Asia | 94.0 /100 | #114 | Exceptional $99,516 |
| Carpatho Rusyns | 93.7 /100 | #115 | Exceptional $99,449 |
| Portuguese | 93.7 /100 | #116 | Exceptional $99,429 |
| Immigrants | Northern Africa | 93.0 /100 | #117 | Exceptional $99,232 |
| Syrians | 92.9 /100 | #118 | Exceptional $99,215 |
| Jordanians | 92.8 /100 | #119 | Exceptional $99,186 |
| Swedes | 92.7 /100 | #120 | Exceptional $99,136 |
| Peruvians | 91.7 /100 | #121 | Exceptional $98,886 |
| Immigrants | Uzbekistan | 91.5 /100 | #122 | Exceptional $98,849 |
| Palestinians | 91.2 /100 | #123 | Exceptional $98,777 |
| Zimbabweans | 90.3 /100 | #124 | Exceptional $98,586 |