Immigrants from Italy vs Mexican American Indian Householder Income Over 65 years
COMPARE
Immigrants from Italy
Mexican American Indian
Householder Income Over 65 years
Householder Income Over 65 years Comparison
Immigrants from Italy
Mexican American Indians
$64,065
HOUSEHOLDER INCOME OVER 65 YEARS
96.2/ 100
METRIC RATING
101st/ 347
METRIC RANK
$56,089
HOUSEHOLDER INCOME OVER 65 YEARS
0.6/ 100
METRIC RATING
249th/ 347
METRIC RANK
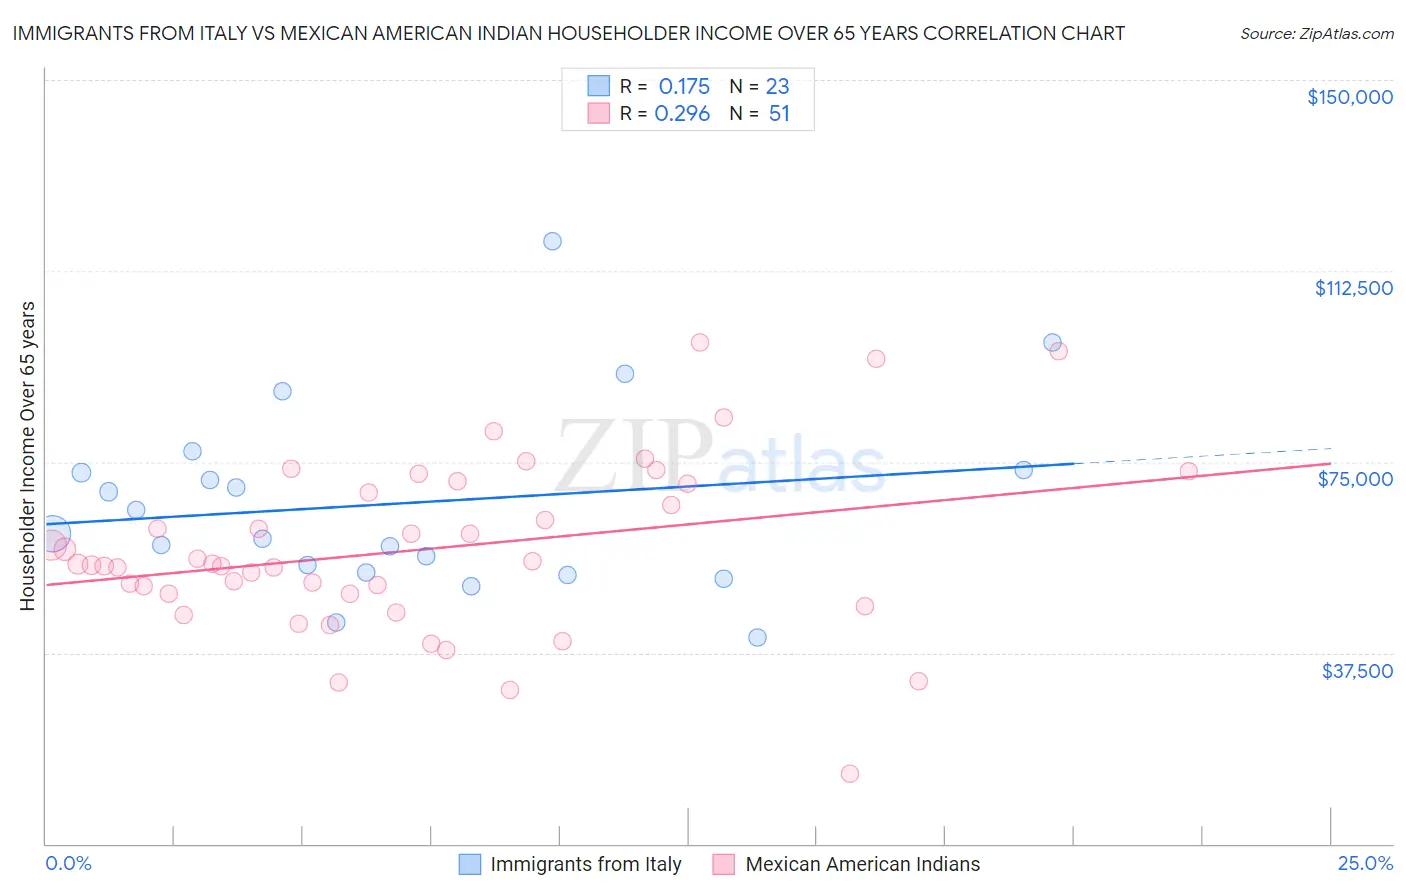
Immigrants from Italy vs Mexican American Indian Householder Income Over 65 years Correlation Chart
The statistical analysis conducted on geographies consisting of 323,658,132 people shows a poor positive correlation between the proportion of Immigrants from Italy and household income with householder over the age of 65 in the United States with a correlation coefficient (R) of 0.175 and weighted average of $64,065. Similarly, the statistical analysis conducted on geographies consisting of 316,694,324 people shows a weak positive correlation between the proportion of Mexican American Indians and household income with householder over the age of 65 in the United States with a correlation coefficient (R) of 0.296 and weighted average of $56,089, a difference of 14.2%.
Householder Income Over 65 years Correlation Summary
| Measurement | Immigrants from Italy | Mexican American Indian |
| Minimum | $40,625 | $13,750 |
| Maximum | $118,263 | $98,333 |
| Range | $77,638 | $84,583 |
| Mean | $66,915 | $57,833 |
| Median | $60,782 | $54,877 |
| Interquartile 25% (IQ1) | $53,273 | $48,998 |
| Interquartile 75% (IQ3) | $73,333 | $70,643 |
| Interquartile Range (IQR) | $20,060 | $21,645 |
| Standard Deviation (Sample) | $18,554 | $16,994 |
| Standard Deviation (Population) | $18,146 | $16,827 |
Similar Demographics by Householder Income Over 65 years
Demographics Similar to Immigrants from Italy by Householder Income Over 65 years
In terms of householder income over 65 years, the demographic groups most similar to Immigrants from Italy are Immigrants from South Eastern Asia ($64,089, a difference of 0.040%), Assyrian/Chaldean/Syriac ($64,108, a difference of 0.070%), Romanian ($64,142, a difference of 0.12%), Chilean ($63,957, a difference of 0.17%), and British ($63,940, a difference of 0.20%).
| Demographics | Rating | Rank | Householder Income Over 65 years |
| Immigrants | Egypt | 97.0 /100 | #94 | Exceptional $64,299 |
| Immigrants | Latvia | 97.0 /100 | #95 | Exceptional $64,298 |
| Immigrants | Hungary | 97.0 /100 | #96 | Exceptional $64,277 |
| Sri Lankans | 96.7 /100 | #97 | Exceptional $64,201 |
| Romanians | 96.5 /100 | #98 | Exceptional $64,142 |
| Assyrians/Chaldeans/Syriacs | 96.4 /100 | #99 | Exceptional $64,108 |
| Immigrants | South Eastern Asia | 96.3 /100 | #100 | Exceptional $64,089 |
| Immigrants | Italy | 96.2 /100 | #101 | Exceptional $64,065 |
| Chileans | 95.8 /100 | #102 | Exceptional $63,957 |
| British | 95.7 /100 | #103 | Exceptional $63,940 |
| Immigrants | Cameroon | 95.6 /100 | #104 | Exceptional $63,907 |
| Italians | 95.5 /100 | #105 | Exceptional $63,885 |
| Immigrants | Argentina | 95.5 /100 | #106 | Exceptional $63,885 |
| Pakistanis | 95.3 /100 | #107 | Exceptional $63,844 |
| Palestinians | 95.1 /100 | #108 | Exceptional $63,800 |
Demographics Similar to Mexican American Indians by Householder Income Over 65 years
In terms of householder income over 65 years, the demographic groups most similar to Mexican American Indians are Vietnamese ($56,143, a difference of 0.10%), Immigrants from Bosnia and Herzegovina ($55,986, a difference of 0.19%), Yakama ($56,234, a difference of 0.26%), Immigrants from Portugal ($55,924, a difference of 0.30%), and Central American ($56,321, a difference of 0.41%).
| Demographics | Rating | Rank | Householder Income Over 65 years |
| Yaqui | 0.8 /100 | #242 | Tragic $56,417 |
| Guyanese | 0.8 /100 | #243 | Tragic $56,351 |
| Hmong | 0.8 /100 | #244 | Tragic $56,339 |
| Immigrants | Uzbekistan | 0.8 /100 | #245 | Tragic $56,331 |
| Central Americans | 0.8 /100 | #246 | Tragic $56,321 |
| Yakama | 0.7 /100 | #247 | Tragic $56,234 |
| Vietnamese | 0.6 /100 | #248 | Tragic $56,143 |
| Mexican American Indians | 0.6 /100 | #249 | Tragic $56,089 |
| Immigrants | Bosnia and Herzegovina | 0.5 /100 | #250 | Tragic $55,986 |
| Immigrants | Portugal | 0.5 /100 | #251 | Tragic $55,924 |
| Osage | 0.4 /100 | #252 | Tragic $55,677 |
| Immigrants | Trinidad and Tobago | 0.4 /100 | #253 | Tragic $55,598 |
| Americans | 0.3 /100 | #254 | Tragic $55,527 |
| Immigrants | Bangladesh | 0.3 /100 | #255 | Tragic $55,394 |
| German Russians | 0.3 /100 | #256 | Tragic $55,356 |