Immigrants from Italy vs Immigrants from West Indies Householder Income Over 65 years
COMPARE
Immigrants from Italy
Immigrants from West Indies
Householder Income Over 65 years
Householder Income Over 65 years Comparison
Immigrants from Italy
Immigrants from West Indies
$64,065
HOUSEHOLDER INCOME OVER 65 YEARS
96.2/ 100
METRIC RATING
101st/ 347
METRIC RANK
$54,927
HOUSEHOLDER INCOME OVER 65 YEARS
0.2/ 100
METRIC RATING
260th/ 347
METRIC RANK
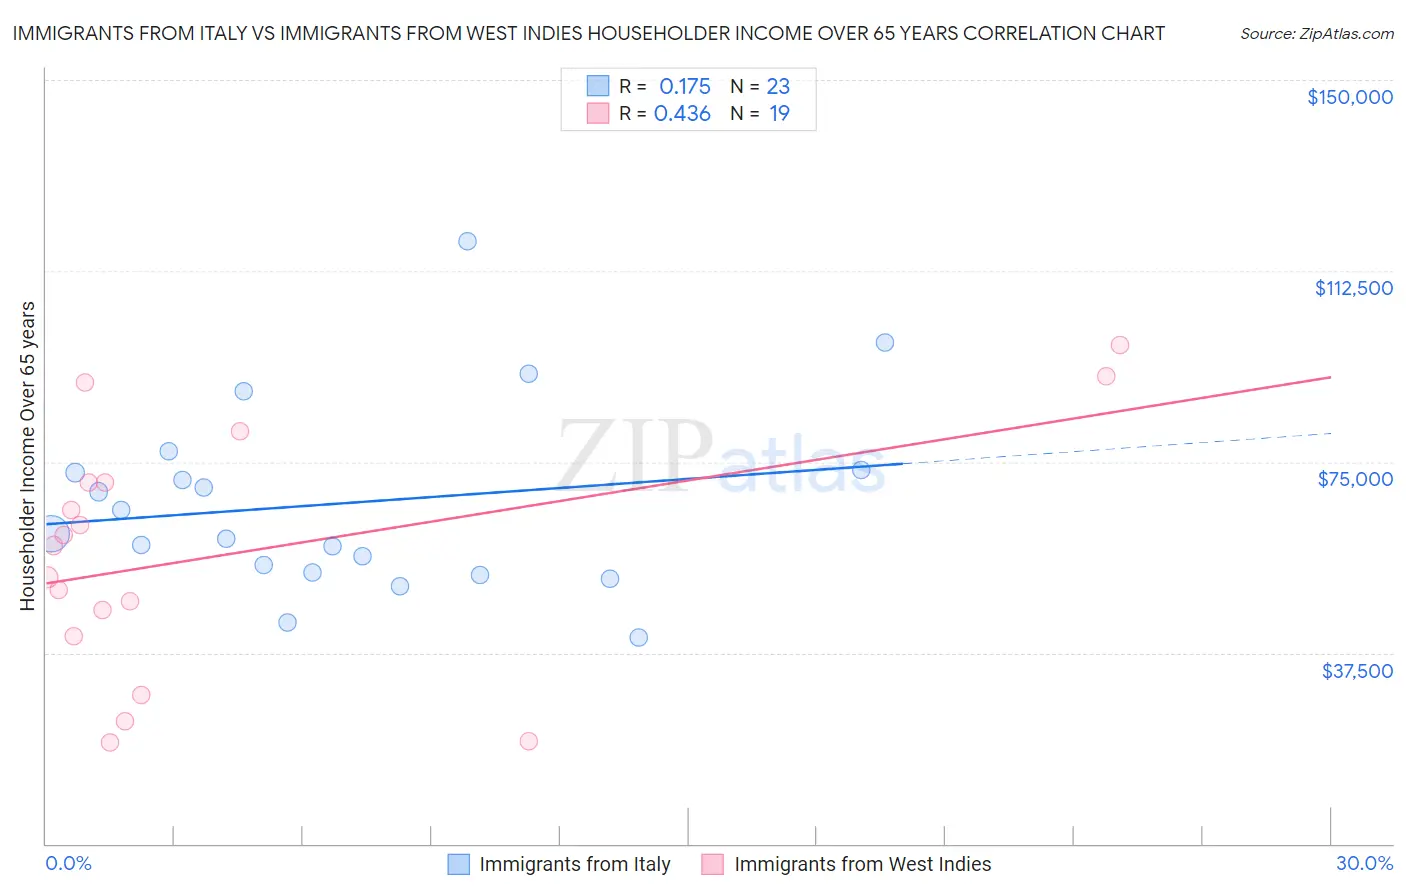
Immigrants from Italy vs Immigrants from West Indies Householder Income Over 65 years Correlation Chart
The statistical analysis conducted on geographies consisting of 323,658,132 people shows a poor positive correlation between the proportion of Immigrants from Italy and household income with householder over the age of 65 in the United States with a correlation coefficient (R) of 0.175 and weighted average of $64,065. Similarly, the statistical analysis conducted on geographies consisting of 72,436,057 people shows a moderate positive correlation between the proportion of Immigrants from West Indies and household income with householder over the age of 65 in the United States with a correlation coefficient (R) of 0.436 and weighted average of $54,927, a difference of 16.6%.
Householder Income Over 65 years Correlation Summary
| Measurement | Immigrants from Italy | Immigrants from West Indies |
| Minimum | $40,625 | $19,854 |
| Maximum | $118,263 | $97,868 |
| Range | $77,638 | $78,014 |
| Mean | $66,915 | $56,850 |
| Median | $60,782 | $58,586 |
| Interquartile 25% (IQ1) | $53,273 | $40,706 |
| Interquartile 75% (IQ3) | $73,333 | $70,875 |
| Interquartile Range (IQR) | $20,060 | $30,169 |
| Standard Deviation (Sample) | $18,554 | $23,837 |
| Standard Deviation (Population) | $18,146 | $23,201 |
Similar Demographics by Householder Income Over 65 years
Demographics Similar to Immigrants from Italy by Householder Income Over 65 years
In terms of householder income over 65 years, the demographic groups most similar to Immigrants from Italy are Immigrants from South Eastern Asia ($64,089, a difference of 0.040%), Assyrian/Chaldean/Syriac ($64,108, a difference of 0.070%), Romanian ($64,142, a difference of 0.12%), Chilean ($63,957, a difference of 0.17%), and British ($63,940, a difference of 0.20%).
| Demographics | Rating | Rank | Householder Income Over 65 years |
| Immigrants | Egypt | 97.0 /100 | #94 | Exceptional $64,299 |
| Immigrants | Latvia | 97.0 /100 | #95 | Exceptional $64,298 |
| Immigrants | Hungary | 97.0 /100 | #96 | Exceptional $64,277 |
| Sri Lankans | 96.7 /100 | #97 | Exceptional $64,201 |
| Romanians | 96.5 /100 | #98 | Exceptional $64,142 |
| Assyrians/Chaldeans/Syriacs | 96.4 /100 | #99 | Exceptional $64,108 |
| Immigrants | South Eastern Asia | 96.3 /100 | #100 | Exceptional $64,089 |
| Immigrants | Italy | 96.2 /100 | #101 | Exceptional $64,065 |
| Chileans | 95.8 /100 | #102 | Exceptional $63,957 |
| British | 95.7 /100 | #103 | Exceptional $63,940 |
| Immigrants | Cameroon | 95.6 /100 | #104 | Exceptional $63,907 |
| Italians | 95.5 /100 | #105 | Exceptional $63,885 |
| Immigrants | Argentina | 95.5 /100 | #106 | Exceptional $63,885 |
| Pakistanis | 95.3 /100 | #107 | Exceptional $63,844 |
| Palestinians | 95.1 /100 | #108 | Exceptional $63,800 |
Demographics Similar to Immigrants from West Indies by Householder Income Over 65 years
In terms of householder income over 65 years, the demographic groups most similar to Immigrants from West Indies are Comanche ($54,922, a difference of 0.010%), West Indian ($54,936, a difference of 0.020%), Ecuadorian ($54,958, a difference of 0.060%), Bangladeshi ($54,719, a difference of 0.38%), and French American Indian ($54,699, a difference of 0.42%).
| Demographics | Rating | Rank | Householder Income Over 65 years |
| Immigrants | Trinidad and Tobago | 0.4 /100 | #253 | Tragic $55,598 |
| Americans | 0.3 /100 | #254 | Tragic $55,527 |
| Immigrants | Bangladesh | 0.3 /100 | #255 | Tragic $55,394 |
| German Russians | 0.3 /100 | #256 | Tragic $55,356 |
| Trinidadians and Tobagonians | 0.3 /100 | #257 | Tragic $55,327 |
| Ecuadorians | 0.2 /100 | #258 | Tragic $54,958 |
| West Indians | 0.2 /100 | #259 | Tragic $54,936 |
| Immigrants | West Indies | 0.2 /100 | #260 | Tragic $54,927 |
| Comanche | 0.2 /100 | #261 | Tragic $54,922 |
| Bangladeshis | 0.1 /100 | #262 | Tragic $54,719 |
| French American Indians | 0.1 /100 | #263 | Tragic $54,699 |
| Apache | 0.1 /100 | #264 | Tragic $54,668 |
| Belizeans | 0.1 /100 | #265 | Tragic $54,580 |
| Jamaicans | 0.1 /100 | #266 | Tragic $54,560 |
| Guatemalans | 0.1 /100 | #267 | Tragic $54,526 |