Immigrants from Italy vs Immigrants from Somalia Householder Income Ages 25 - 44 years
COMPARE
Immigrants from Italy
Immigrants from Somalia
Householder Income Ages 25 - 44 years
Householder Income Ages 25 - 44 years Comparison
Immigrants from Italy
Immigrants from Somalia
$105,201
HOUSEHOLDER INCOME AGES 25 - 44 YEARS
99.7/ 100
METRIC RATING
62nd/ 347
METRIC RANK
$82,188
HOUSEHOLDER INCOME AGES 25 - 44 YEARS
0.1/ 100
METRIC RATING
285th/ 347
METRIC RANK
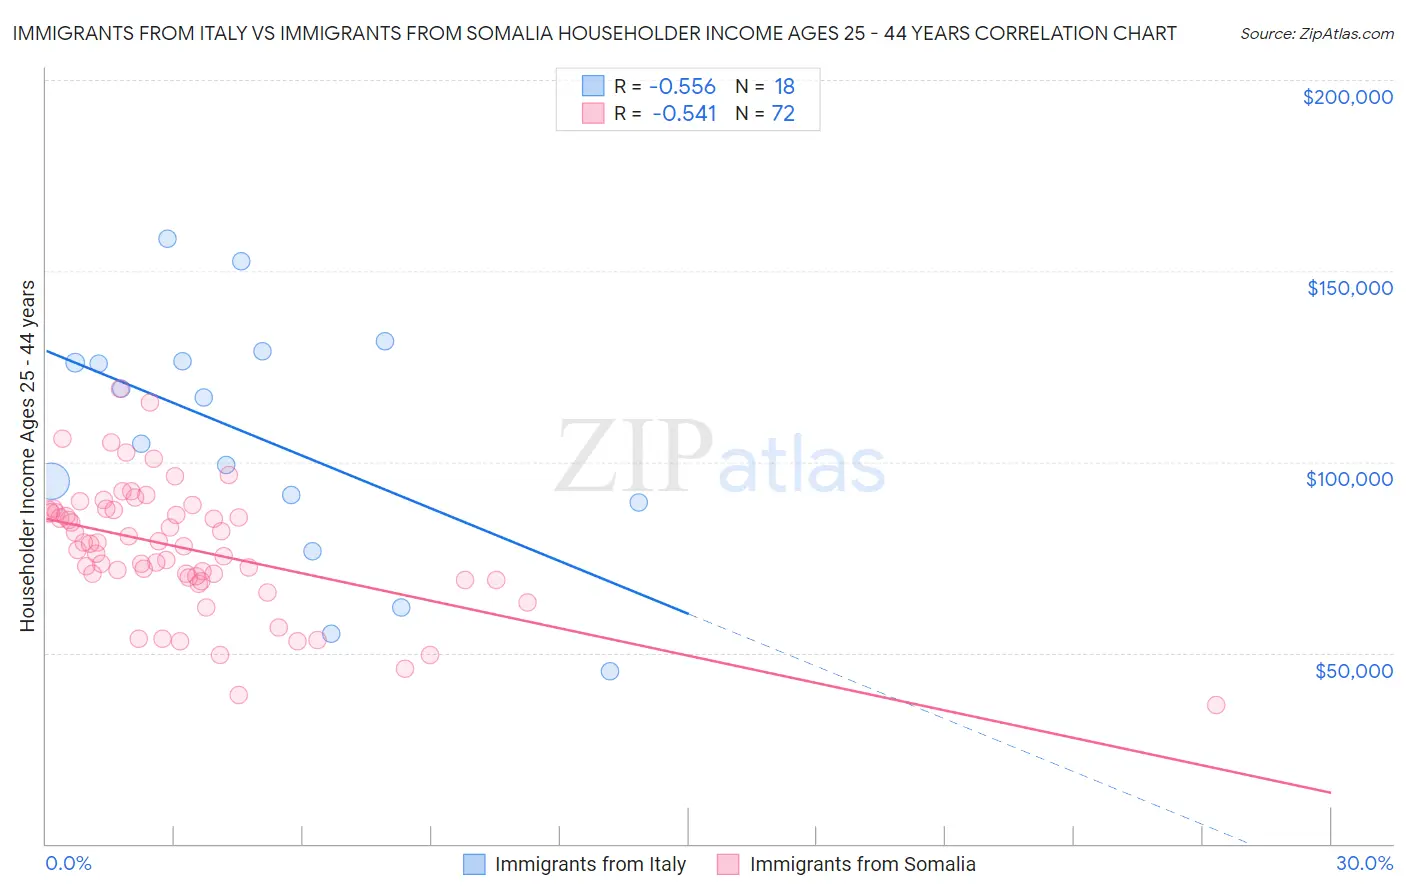
Immigrants from Italy vs Immigrants from Somalia Householder Income Ages 25 - 44 years Correlation Chart
The statistical analysis conducted on geographies consisting of 323,420,404 people shows a substantial negative correlation between the proportion of Immigrants from Italy and household income with householder between the ages 25 and 44 in the United States with a correlation coefficient (R) of -0.556 and weighted average of $105,201. Similarly, the statistical analysis conducted on geographies consisting of 92,085,049 people shows a substantial negative correlation between the proportion of Immigrants from Somalia and household income with householder between the ages 25 and 44 in the United States with a correlation coefficient (R) of -0.541 and weighted average of $82,188, a difference of 28.0%.
Householder Income Ages 25 - 44 years Correlation Summary
| Measurement | Immigrants from Italy | Immigrants from Somalia |
| Minimum | $45,256 | $36,409 |
| Maximum | $158,531 | $119,233 |
| Range | $113,275 | $82,824 |
| Mean | $105,762 | $77,251 |
| Median | $110,729 | $78,315 |
| Interquartile 25% (IQ1) | $89,375 | $69,397 |
| Interquartile 75% (IQ3) | $126,307 | $87,226 |
| Interquartile Range (IQR) | $36,932 | $17,829 |
| Standard Deviation (Sample) | $31,956 | $16,543 |
| Standard Deviation (Population) | $31,055 | $16,428 |
Similar Demographics by Householder Income Ages 25 - 44 years
Demographics Similar to Immigrants from Italy by Householder Income Ages 25 - 44 years
In terms of householder income ages 25 - 44 years, the demographic groups most similar to Immigrants from Italy are Lithuanian ($105,223, a difference of 0.020%), Egyptian ($105,282, a difference of 0.080%), Immigrants from Scotland ($105,089, a difference of 0.11%), New Zealander ($105,085, a difference of 0.11%), and Immigrants from Netherlands ($105,082, a difference of 0.11%).
| Demographics | Rating | Rank | Householder Income Ages 25 - 44 years |
| Greeks | 99.9 /100 | #55 | Exceptional $106,457 |
| Immigrants | Pakistan | 99.8 /100 | #56 | Exceptional $106,129 |
| Immigrants | Austria | 99.8 /100 | #57 | Exceptional $106,103 |
| Immigrants | South Africa | 99.8 /100 | #58 | Exceptional $105,748 |
| Immigrants | Latvia | 99.8 /100 | #59 | Exceptional $105,522 |
| Egyptians | 99.7 /100 | #60 | Exceptional $105,282 |
| Lithuanians | 99.7 /100 | #61 | Exceptional $105,223 |
| Immigrants | Italy | 99.7 /100 | #62 | Exceptional $105,201 |
| Immigrants | Scotland | 99.7 /100 | #63 | Exceptional $105,089 |
| New Zealanders | 99.7 /100 | #64 | Exceptional $105,085 |
| Immigrants | Netherlands | 99.7 /100 | #65 | Exceptional $105,082 |
| Laotians | 99.7 /100 | #66 | Exceptional $104,993 |
| Immigrants | Romania | 99.6 /100 | #67 | Exceptional $104,713 |
| Immigrants | Eastern Europe | 99.6 /100 | #68 | Exceptional $104,662 |
| Mongolians | 99.6 /100 | #69 | Exceptional $104,578 |
Demographics Similar to Immigrants from Somalia by Householder Income Ages 25 - 44 years
In terms of householder income ages 25 - 44 years, the demographic groups most similar to Immigrants from Somalia are Ute ($82,166, a difference of 0.030%), Immigrants from Latin America ($82,166, a difference of 0.030%), Comanche ($82,152, a difference of 0.040%), Immigrants from Middle Africa ($82,254, a difference of 0.080%), and Shoshone ($82,062, a difference of 0.15%).
| Demographics | Rating | Rank | Householder Income Ages 25 - 44 years |
| Senegalese | 0.2 /100 | #278 | Tragic $82,852 |
| Pima | 0.1 /100 | #279 | Tragic $82,821 |
| Colville | 0.1 /100 | #280 | Tragic $82,604 |
| Cajuns | 0.1 /100 | #281 | Tragic $82,393 |
| Central American Indians | 0.1 /100 | #282 | Tragic $82,355 |
| Guatemalans | 0.1 /100 | #283 | Tragic $82,331 |
| Immigrants | Middle Africa | 0.1 /100 | #284 | Tragic $82,254 |
| Immigrants | Somalia | 0.1 /100 | #285 | Tragic $82,188 |
| Ute | 0.1 /100 | #286 | Tragic $82,166 |
| Immigrants | Latin America | 0.1 /100 | #287 | Tragic $82,166 |
| Comanche | 0.1 /100 | #288 | Tragic $82,152 |
| Shoshone | 0.1 /100 | #289 | Tragic $82,062 |
| Liberians | 0.1 /100 | #290 | Tragic $82,005 |
| Potawatomi | 0.1 /100 | #291 | Tragic $81,774 |
| Yaqui | 0.1 /100 | #292 | Tragic $81,656 |