Immigrants from Iran vs Welsh Householder Income Ages 25 - 44 years
COMPARE
Immigrants from Iran
Welsh
Householder Income Ages 25 - 44 years
Householder Income Ages 25 - 44 years Comparison
Immigrants from Iran
Welsh
$119,204
HOUSEHOLDER INCOME AGES 25 - 44 YEARS
100.0/ 100
METRIC RATING
12th/ 347
METRIC RANK
$93,039
HOUSEHOLDER INCOME AGES 25 - 44 YEARS
30.0/ 100
METRIC RATING
190th/ 347
METRIC RANK
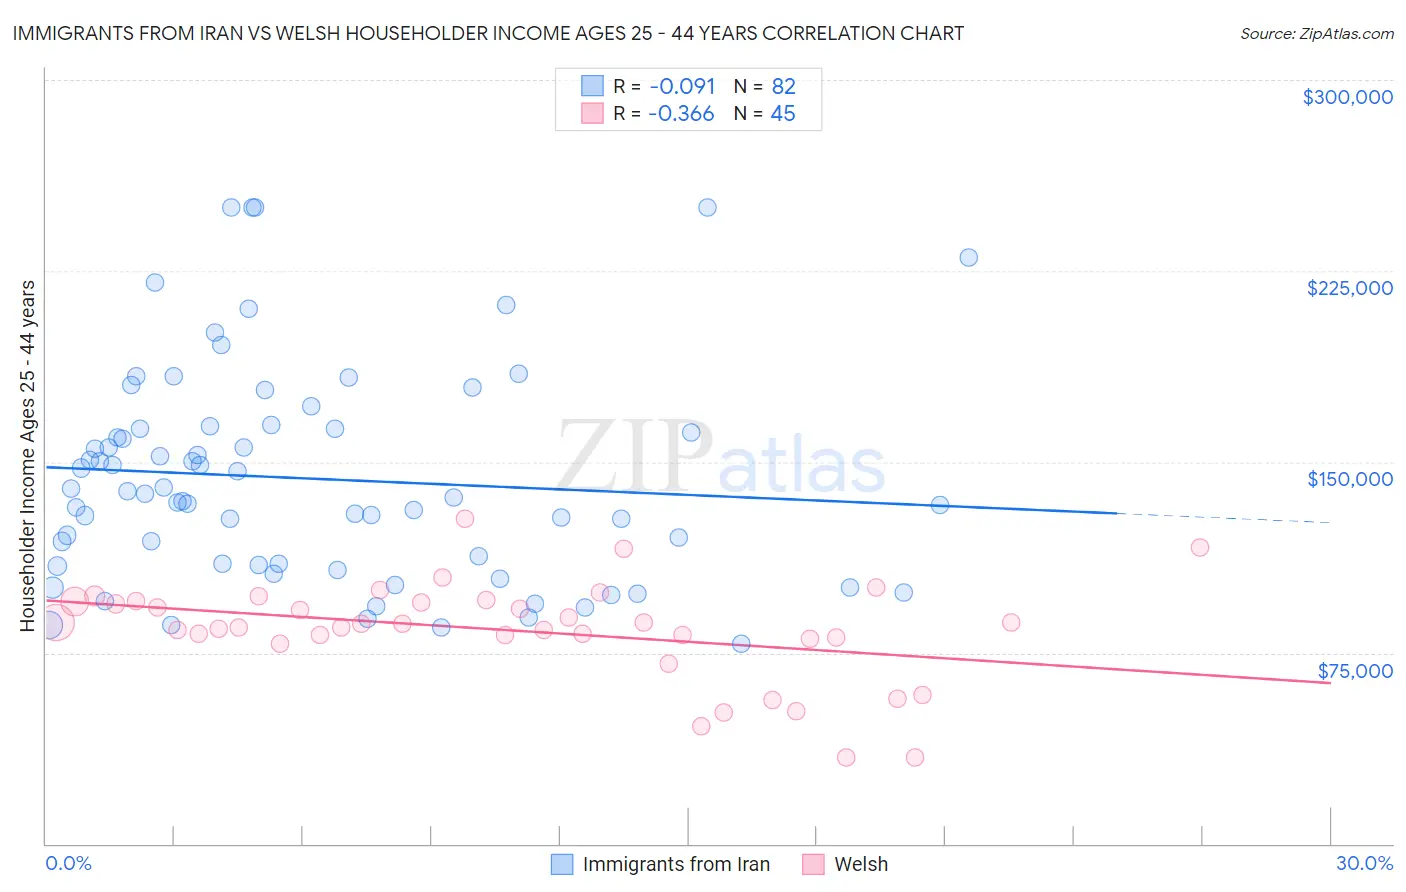
Immigrants from Iran vs Welsh Householder Income Ages 25 - 44 years Correlation Chart
The statistical analysis conducted on geographies consisting of 279,573,496 people shows a slight negative correlation between the proportion of Immigrants from Iran and household income with householder between the ages 25 and 44 in the United States with a correlation coefficient (R) of -0.091 and weighted average of $119,204. Similarly, the statistical analysis conducted on geographies consisting of 524,969,019 people shows a mild negative correlation between the proportion of Welsh and household income with householder between the ages 25 and 44 in the United States with a correlation coefficient (R) of -0.366 and weighted average of $93,039, a difference of 28.1%.
Householder Income Ages 25 - 44 years Correlation Summary
| Measurement | Immigrants from Iran | Welsh |
| Minimum | $78,352 | $33,750 |
| Maximum | $250,001 | $127,625 |
| Range | $171,649 | $93,875 |
| Mean | $143,389 | $83,695 |
| Median | $136,696 | $86,585 |
| Interquartile 25% (IQ1) | $109,520 | $80,749 |
| Interquartile 75% (IQ3) | $163,202 | $95,164 |
| Interquartile Range (IQR) | $53,682 | $14,415 |
| Standard Deviation (Sample) | $42,216 | $19,829 |
| Standard Deviation (Population) | $41,958 | $19,607 |
Similar Demographics by Householder Income Ages 25 - 44 years
Demographics Similar to Immigrants from Iran by Householder Income Ages 25 - 44 years
In terms of householder income ages 25 - 44 years, the demographic groups most similar to Immigrants from Iran are Okinawan ($119,349, a difference of 0.12%), Indian (Asian) ($119,496, a difference of 0.25%), Immigrants from China ($119,756, a difference of 0.46%), Iranian ($120,292, a difference of 0.91%), and Immigrants from Ireland ($120,333, a difference of 0.95%).
| Demographics | Rating | Rank | Householder Income Ages 25 - 44 years |
| Immigrants | India | 100.0 /100 | #5 | Exceptional $124,238 |
| Thais | 100.0 /100 | #6 | Exceptional $121,778 |
| Immigrants | Ireland | 100.0 /100 | #7 | Exceptional $120,333 |
| Iranians | 100.0 /100 | #8 | Exceptional $120,292 |
| Immigrants | China | 100.0 /100 | #9 | Exceptional $119,756 |
| Indians (Asian) | 100.0 /100 | #10 | Exceptional $119,496 |
| Okinawans | 100.0 /100 | #11 | Exceptional $119,349 |
| Immigrants | Iran | 100.0 /100 | #12 | Exceptional $119,204 |
| Immigrants | Eastern Asia | 100.0 /100 | #13 | Exceptional $118,056 |
| Immigrants | Israel | 100.0 /100 | #14 | Exceptional $117,219 |
| Immigrants | South Central Asia | 100.0 /100 | #15 | Exceptional $116,626 |
| Cypriots | 100.0 /100 | #16 | Exceptional $116,364 |
| Immigrants | Australia | 100.0 /100 | #17 | Exceptional $115,947 |
| Eastern Europeans | 100.0 /100 | #18 | Exceptional $114,523 |
| Burmese | 100.0 /100 | #19 | Exceptional $113,701 |
Demographics Similar to Welsh by Householder Income Ages 25 - 44 years
In terms of householder income ages 25 - 44 years, the demographic groups most similar to Welsh are Dutch ($93,081, a difference of 0.040%), Tlingit-Haida ($92,987, a difference of 0.060%), Immigrants from Sierra Leone ($93,115, a difference of 0.080%), Immigrants from Costa Rica ($92,876, a difference of 0.18%), and Spaniard ($93,366, a difference of 0.35%).
| Demographics | Rating | Rank | Householder Income Ages 25 - 44 years |
| Guamanians/Chamorros | 36.5 /100 | #183 | Fair $93,569 |
| Germans | 36.0 /100 | #184 | Fair $93,531 |
| Immigrants | Eritrea | 35.2 /100 | #185 | Fair $93,466 |
| Sierra Leoneans | 34.8 /100 | #186 | Fair $93,435 |
| Spaniards | 34.0 /100 | #187 | Fair $93,366 |
| Immigrants | Sierra Leone | 30.9 /100 | #188 | Fair $93,115 |
| Dutch | 30.5 /100 | #189 | Fair $93,081 |
| Welsh | 30.0 /100 | #190 | Fair $93,039 |
| Tlingit-Haida | 29.4 /100 | #191 | Fair $92,987 |
| Immigrants | Costa Rica | 28.2 /100 | #192 | Fair $92,876 |
| Samoans | 23.0 /100 | #193 | Fair $92,385 |
| Immigrants | Azores | 22.4 /100 | #194 | Fair $92,322 |
| Celtics | 21.6 /100 | #195 | Fair $92,241 |
| Immigrants | Colombia | 21.3 /100 | #196 | Fair $92,204 |
| Spanish | 21.2 /100 | #197 | Fair $92,200 |