Immigrants from Iran vs Polish Householder Income Ages 25 - 44 years
COMPARE
Immigrants from Iran
Polish
Householder Income Ages 25 - 44 years
Householder Income Ages 25 - 44 years Comparison
Immigrants from Iran
Poles
$119,204
HOUSEHOLDER INCOME AGES 25 - 44 YEARS
100.0/ 100
METRIC RATING
12th/ 347
METRIC RANK
$99,685
HOUSEHOLDER INCOME AGES 25 - 44 YEARS
94.5/ 100
METRIC RATING
112th/ 347
METRIC RANK
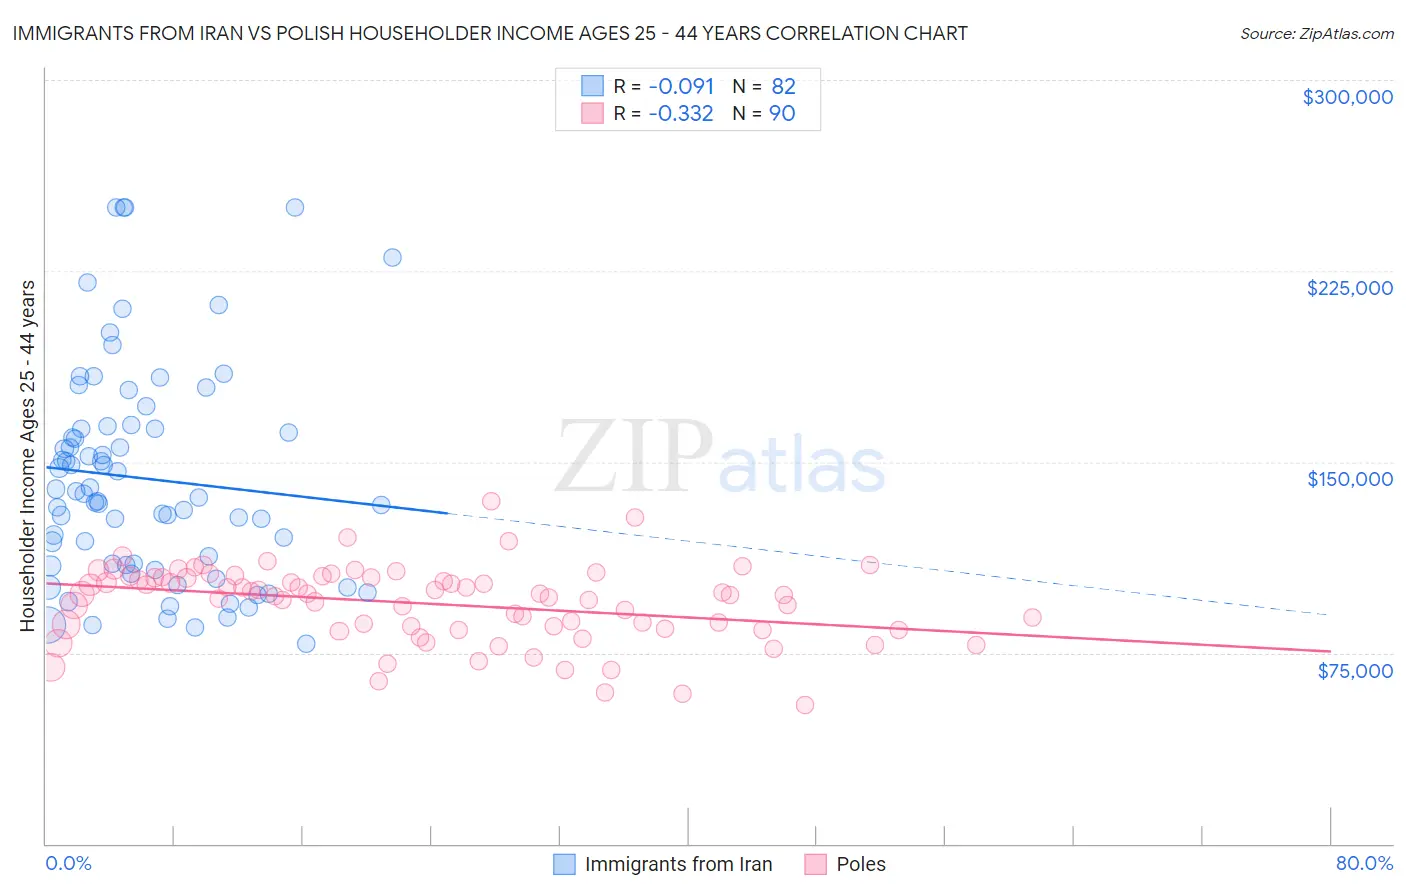
Immigrants from Iran vs Polish Householder Income Ages 25 - 44 years Correlation Chart
The statistical analysis conducted on geographies consisting of 279,573,496 people shows a slight negative correlation between the proportion of Immigrants from Iran and household income with householder between the ages 25 and 44 in the United States with a correlation coefficient (R) of -0.091 and weighted average of $119,204. Similarly, the statistical analysis conducted on geographies consisting of 555,649,021 people shows a mild negative correlation between the proportion of Poles and household income with householder between the ages 25 and 44 in the United States with a correlation coefficient (R) of -0.332 and weighted average of $99,685, a difference of 19.6%.
Householder Income Ages 25 - 44 years Correlation Summary
| Measurement | Immigrants from Iran | Polish |
| Minimum | $78,352 | $54,279 |
| Maximum | $250,001 | $134,668 |
| Range | $171,649 | $80,389 |
| Mean | $143,389 | $94,388 |
| Median | $136,696 | $97,963 |
| Interquartile 25% (IQ1) | $109,520 | $84,559 |
| Interquartile 75% (IQ3) | $163,202 | $104,554 |
| Interquartile Range (IQR) | $53,682 | $19,995 |
| Standard Deviation (Sample) | $42,216 | $15,033 |
| Standard Deviation (Population) | $41,958 | $14,949 |
Similar Demographics by Householder Income Ages 25 - 44 years
Demographics Similar to Immigrants from Iran by Householder Income Ages 25 - 44 years
In terms of householder income ages 25 - 44 years, the demographic groups most similar to Immigrants from Iran are Okinawan ($119,349, a difference of 0.12%), Indian (Asian) ($119,496, a difference of 0.25%), Immigrants from China ($119,756, a difference of 0.46%), Iranian ($120,292, a difference of 0.91%), and Immigrants from Ireland ($120,333, a difference of 0.95%).
| Demographics | Rating | Rank | Householder Income Ages 25 - 44 years |
| Immigrants | India | 100.0 /100 | #5 | Exceptional $124,238 |
| Thais | 100.0 /100 | #6 | Exceptional $121,778 |
| Immigrants | Ireland | 100.0 /100 | #7 | Exceptional $120,333 |
| Iranians | 100.0 /100 | #8 | Exceptional $120,292 |
| Immigrants | China | 100.0 /100 | #9 | Exceptional $119,756 |
| Indians (Asian) | 100.0 /100 | #10 | Exceptional $119,496 |
| Okinawans | 100.0 /100 | #11 | Exceptional $119,349 |
| Immigrants | Iran | 100.0 /100 | #12 | Exceptional $119,204 |
| Immigrants | Eastern Asia | 100.0 /100 | #13 | Exceptional $118,056 |
| Immigrants | Israel | 100.0 /100 | #14 | Exceptional $117,219 |
| Immigrants | South Central Asia | 100.0 /100 | #15 | Exceptional $116,626 |
| Cypriots | 100.0 /100 | #16 | Exceptional $116,364 |
| Immigrants | Australia | 100.0 /100 | #17 | Exceptional $115,947 |
| Eastern Europeans | 100.0 /100 | #18 | Exceptional $114,523 |
| Burmese | 100.0 /100 | #19 | Exceptional $113,701 |
Demographics Similar to Poles by Householder Income Ages 25 - 44 years
In terms of householder income ages 25 - 44 years, the demographic groups most similar to Poles are Tongan ($99,604, a difference of 0.080%), Immigrants from Western Asia ($99,516, a difference of 0.17%), Chilean ($99,900, a difference of 0.22%), Carpatho Rusyn ($99,449, a difference of 0.24%), and Portuguese ($99,429, a difference of 0.26%).
| Demographics | Rating | Rank | Householder Income Ages 25 - 44 years |
| Immigrants | Vietnam | 96.5 /100 | #105 | Exceptional $100,535 |
| Immigrants | Brazil | 96.5 /100 | #106 | Exceptional $100,534 |
| Northern Europeans | 96.3 /100 | #107 | Exceptional $100,457 |
| Immigrants | South Eastern Asia | 96.0 /100 | #108 | Exceptional $100,283 |
| Immigrants | North Macedonia | 95.6 /100 | #109 | Exceptional $100,101 |
| Immigrants | Afghanistan | 95.3 /100 | #110 | Exceptional $99,977 |
| Chileans | 95.1 /100 | #111 | Exceptional $99,900 |
| Poles | 94.5 /100 | #112 | Exceptional $99,685 |
| Tongans | 94.2 /100 | #113 | Exceptional $99,604 |
| Immigrants | Western Asia | 94.0 /100 | #114 | Exceptional $99,516 |
| Carpatho Rusyns | 93.7 /100 | #115 | Exceptional $99,449 |
| Portuguese | 93.7 /100 | #116 | Exceptional $99,429 |
| Immigrants | Northern Africa | 93.0 /100 | #117 | Exceptional $99,232 |
| Syrians | 92.9 /100 | #118 | Exceptional $99,215 |
| Jordanians | 92.8 /100 | #119 | Exceptional $99,186 |