Immigrants from Indonesia vs Carpatho Rusyn Householder Income Ages 25 - 44 years
COMPARE
Immigrants from Indonesia
Carpatho Rusyn
Householder Income Ages 25 - 44 years
Householder Income Ages 25 - 44 years Comparison
Immigrants from Indonesia
Carpatho Rusyns
$107,627
HOUSEHOLDER INCOME AGES 25 - 44 YEARS
99.9/ 100
METRIC RATING
44th/ 347
METRIC RANK
$99,449
HOUSEHOLDER INCOME AGES 25 - 44 YEARS
93.7/ 100
METRIC RATING
115th/ 347
METRIC RANK
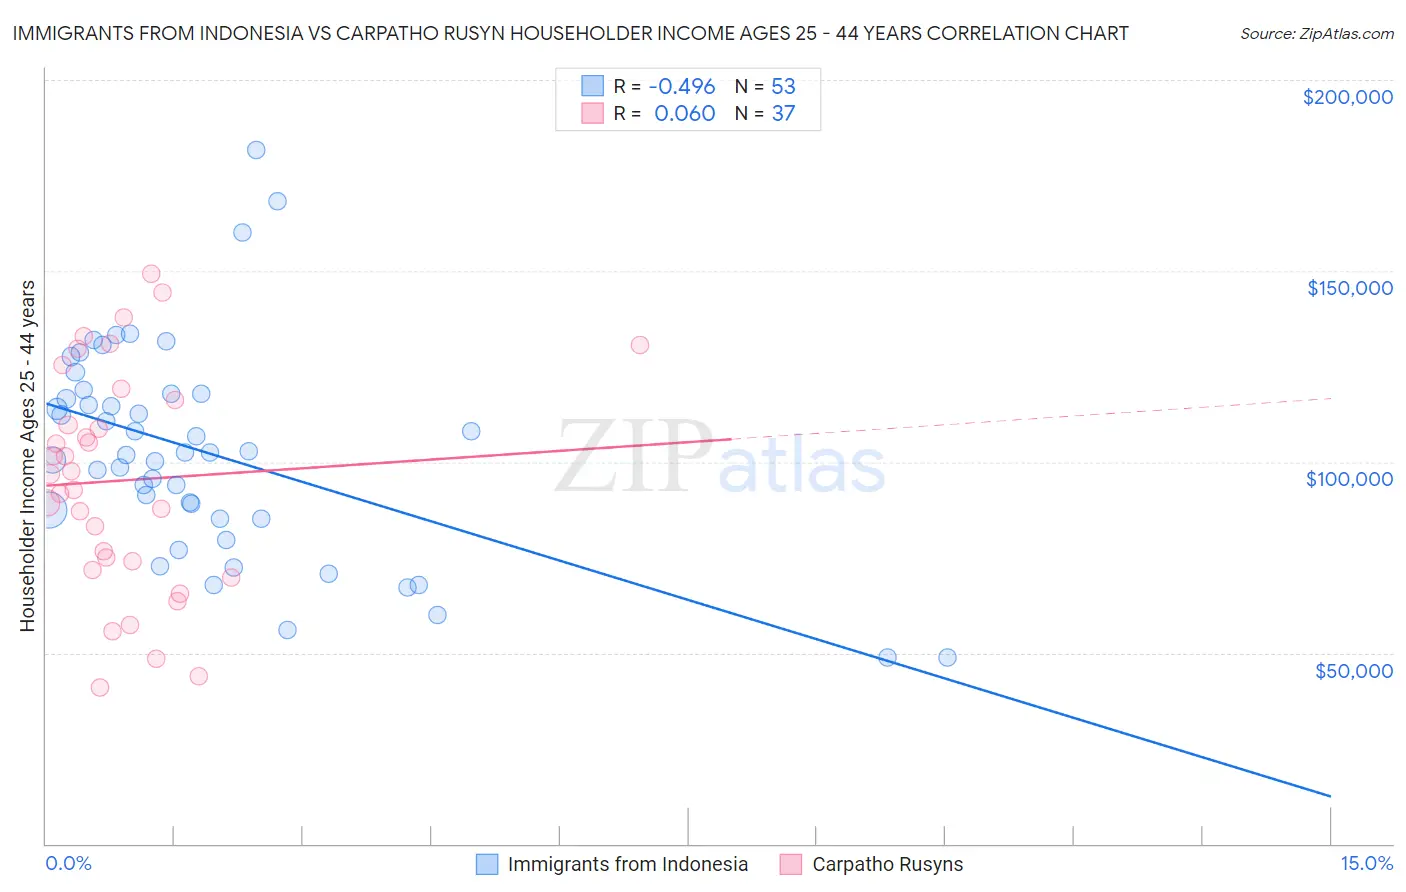
Immigrants from Indonesia vs Carpatho Rusyn Householder Income Ages 25 - 44 years Correlation Chart
The statistical analysis conducted on geographies consisting of 215,479,216 people shows a moderate negative correlation between the proportion of Immigrants from Indonesia and household income with householder between the ages 25 and 44 in the United States with a correlation coefficient (R) of -0.496 and weighted average of $107,627. Similarly, the statistical analysis conducted on geographies consisting of 58,833,038 people shows a slight positive correlation between the proportion of Carpatho Rusyns and household income with householder between the ages 25 and 44 in the United States with a correlation coefficient (R) of 0.060 and weighted average of $99,449, a difference of 8.2%.
Householder Income Ages 25 - 44 years Correlation Summary
| Measurement | Immigrants from Indonesia | Carpatho Rusyn |
| Minimum | $48,644 | $40,789 |
| Maximum | $181,667 | $149,241 |
| Range | $133,023 | $108,452 |
| Mean | $102,424 | $95,167 |
| Median | $102,321 | $96,892 |
| Interquartile 25% (IQ1) | $85,037 | $72,857 |
| Interquartile 75% (IQ3) | $117,969 | $117,797 |
| Interquartile Range (IQR) | $32,932 | $44,941 |
| Standard Deviation (Sample) | $28,015 | $29,061 |
| Standard Deviation (Population) | $27,749 | $28,665 |
Similar Demographics by Householder Income Ages 25 - 44 years
Demographics Similar to Immigrants from Indonesia by Householder Income Ages 25 - 44 years
In terms of householder income ages 25 - 44 years, the demographic groups most similar to Immigrants from Indonesia are Immigrants from Malaysia ($107,650, a difference of 0.020%), Israeli ($107,579, a difference of 0.040%), Immigrants from Belarus ($107,393, a difference of 0.22%), Australian ($107,912, a difference of 0.26%), and Estonian ($107,269, a difference of 0.33%).
| Demographics | Rating | Rank | Householder Income Ages 25 - 44 years |
| Immigrants | Russia | 100.0 /100 | #37 | Exceptional $108,751 |
| Soviet Union | 100.0 /100 | #38 | Exceptional $108,457 |
| Immigrants | France | 99.9 /100 | #39 | Exceptional $108,257 |
| Immigrants | Lithuania | 99.9 /100 | #40 | Exceptional $108,149 |
| Immigrants | Bolivia | 99.9 /100 | #41 | Exceptional $108,128 |
| Australians | 99.9 /100 | #42 | Exceptional $107,912 |
| Immigrants | Malaysia | 99.9 /100 | #43 | Exceptional $107,650 |
| Immigrants | Indonesia | 99.9 /100 | #44 | Exceptional $107,627 |
| Israelis | 99.9 /100 | #45 | Exceptional $107,579 |
| Immigrants | Belarus | 99.9 /100 | #46 | Exceptional $107,393 |
| Estonians | 99.9 /100 | #47 | Exceptional $107,269 |
| Bulgarians | 99.9 /100 | #48 | Exceptional $107,264 |
| Immigrants | Turkey | 99.9 /100 | #49 | Exceptional $107,258 |
| Cambodians | 99.9 /100 | #50 | Exceptional $107,148 |
| Immigrants | Czechoslovakia | 99.9 /100 | #51 | Exceptional $106,888 |
Demographics Similar to Carpatho Rusyns by Householder Income Ages 25 - 44 years
In terms of householder income ages 25 - 44 years, the demographic groups most similar to Carpatho Rusyns are Portuguese ($99,429, a difference of 0.020%), Immigrants from Western Asia ($99,516, a difference of 0.070%), Tongan ($99,604, a difference of 0.16%), Immigrants from Northern Africa ($99,232, a difference of 0.22%), and Polish ($99,685, a difference of 0.24%).
| Demographics | Rating | Rank | Householder Income Ages 25 - 44 years |
| Immigrants | South Eastern Asia | 96.0 /100 | #108 | Exceptional $100,283 |
| Immigrants | North Macedonia | 95.6 /100 | #109 | Exceptional $100,101 |
| Immigrants | Afghanistan | 95.3 /100 | #110 | Exceptional $99,977 |
| Chileans | 95.1 /100 | #111 | Exceptional $99,900 |
| Poles | 94.5 /100 | #112 | Exceptional $99,685 |
| Tongans | 94.2 /100 | #113 | Exceptional $99,604 |
| Immigrants | Western Asia | 94.0 /100 | #114 | Exceptional $99,516 |
| Carpatho Rusyns | 93.7 /100 | #115 | Exceptional $99,449 |
| Portuguese | 93.7 /100 | #116 | Exceptional $99,429 |
| Immigrants | Northern Africa | 93.0 /100 | #117 | Exceptional $99,232 |
| Syrians | 92.9 /100 | #118 | Exceptional $99,215 |
| Jordanians | 92.8 /100 | #119 | Exceptional $99,186 |
| Swedes | 92.7 /100 | #120 | Exceptional $99,136 |
| Peruvians | 91.7 /100 | #121 | Exceptional $98,886 |
| Immigrants | Uzbekistan | 91.5 /100 | #122 | Exceptional $98,849 |