Immigrants from Indonesia vs Paiute Householder Income Ages 25 - 44 years
COMPARE
Immigrants from Indonesia
Paiute
Householder Income Ages 25 - 44 years
Householder Income Ages 25 - 44 years Comparison
Immigrants from Indonesia
Paiute
$107,627
HOUSEHOLDER INCOME AGES 25 - 44 YEARS
99.9/ 100
METRIC RATING
44th/ 347
METRIC RANK
$82,984
HOUSEHOLDER INCOME AGES 25 - 44 YEARS
0.2/ 100
METRIC RATING
277th/ 347
METRIC RANK
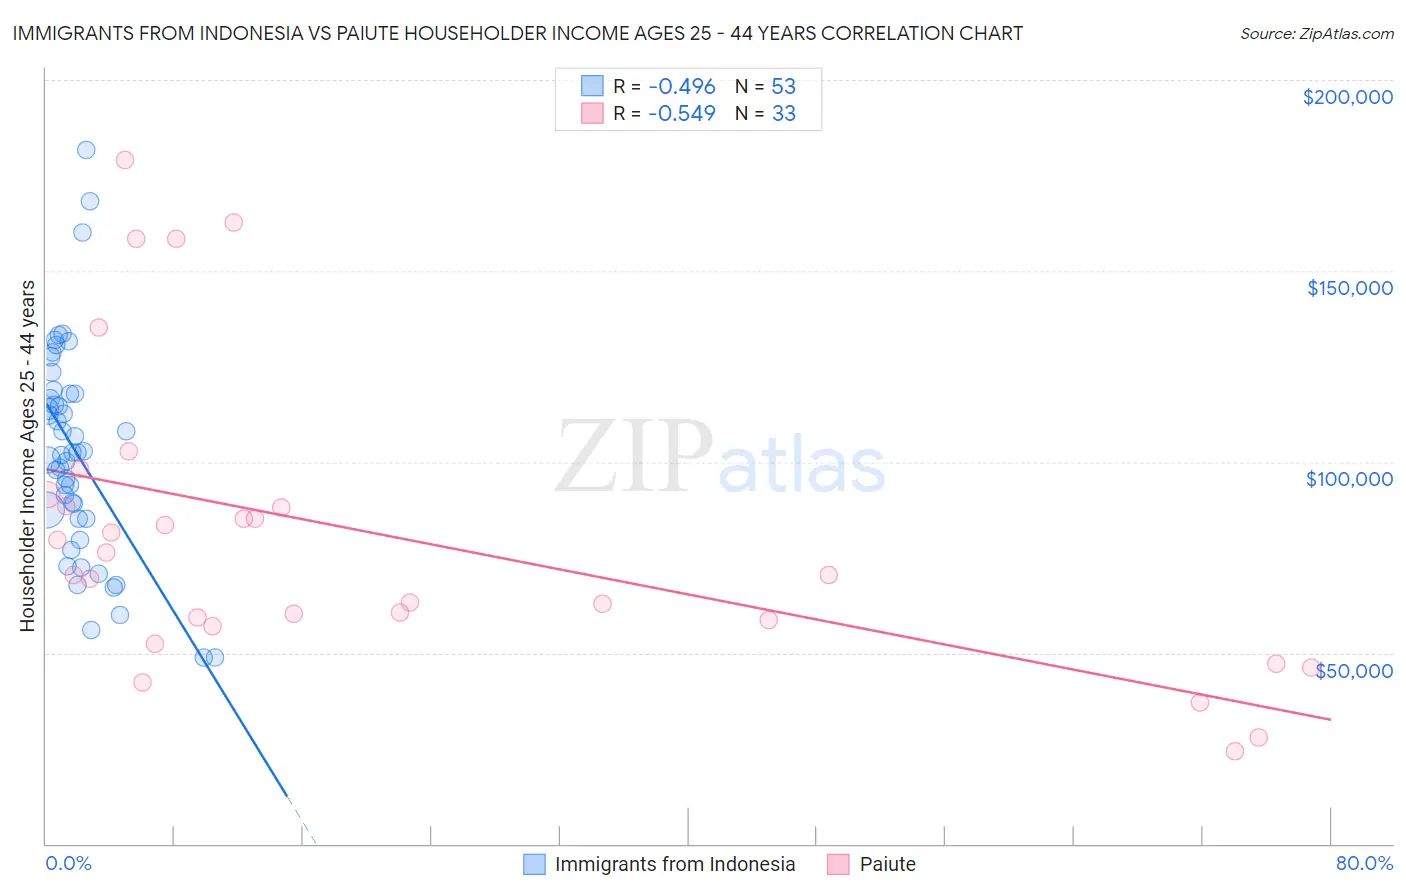
Immigrants from Indonesia vs Paiute Householder Income Ages 25 - 44 years Correlation Chart
The statistical analysis conducted on geographies consisting of 215,479,216 people shows a moderate negative correlation between the proportion of Immigrants from Indonesia and household income with householder between the ages 25 and 44 in the United States with a correlation coefficient (R) of -0.496 and weighted average of $107,627. Similarly, the statistical analysis conducted on geographies consisting of 58,335,630 people shows a substantial negative correlation between the proportion of Paiute and household income with householder between the ages 25 and 44 in the United States with a correlation coefficient (R) of -0.549 and weighted average of $82,984, a difference of 29.7%.
Householder Income Ages 25 - 44 years Correlation Summary
| Measurement | Immigrants from Indonesia | Paiute |
| Minimum | $48,644 | $24,091 |
| Maximum | $181,667 | $179,063 |
| Range | $133,023 | $154,972 |
| Mean | $102,424 | $80,693 |
| Median | $102,321 | $70,417 |
| Interquartile 25% (IQ1) | $85,037 | $57,886 |
| Interquartile 75% (IQ3) | $117,969 | $89,878 |
| Interquartile Range (IQR) | $32,932 | $31,992 |
| Standard Deviation (Sample) | $28,015 | $38,861 |
| Standard Deviation (Population) | $27,749 | $38,267 |
Similar Demographics by Householder Income Ages 25 - 44 years
Demographics Similar to Immigrants from Indonesia by Householder Income Ages 25 - 44 years
In terms of householder income ages 25 - 44 years, the demographic groups most similar to Immigrants from Indonesia are Immigrants from Malaysia ($107,650, a difference of 0.020%), Israeli ($107,579, a difference of 0.040%), Immigrants from Belarus ($107,393, a difference of 0.22%), Australian ($107,912, a difference of 0.26%), and Estonian ($107,269, a difference of 0.33%).
| Demographics | Rating | Rank | Householder Income Ages 25 - 44 years |
| Immigrants | Russia | 100.0 /100 | #37 | Exceptional $108,751 |
| Soviet Union | 100.0 /100 | #38 | Exceptional $108,457 |
| Immigrants | France | 99.9 /100 | #39 | Exceptional $108,257 |
| Immigrants | Lithuania | 99.9 /100 | #40 | Exceptional $108,149 |
| Immigrants | Bolivia | 99.9 /100 | #41 | Exceptional $108,128 |
| Australians | 99.9 /100 | #42 | Exceptional $107,912 |
| Immigrants | Malaysia | 99.9 /100 | #43 | Exceptional $107,650 |
| Immigrants | Indonesia | 99.9 /100 | #44 | Exceptional $107,627 |
| Israelis | 99.9 /100 | #45 | Exceptional $107,579 |
| Immigrants | Belarus | 99.9 /100 | #46 | Exceptional $107,393 |
| Estonians | 99.9 /100 | #47 | Exceptional $107,269 |
| Bulgarians | 99.9 /100 | #48 | Exceptional $107,264 |
| Immigrants | Turkey | 99.9 /100 | #49 | Exceptional $107,258 |
| Cambodians | 99.9 /100 | #50 | Exceptional $107,148 |
| Immigrants | Czechoslovakia | 99.9 /100 | #51 | Exceptional $106,888 |
Demographics Similar to Paiute by Householder Income Ages 25 - 44 years
In terms of householder income ages 25 - 44 years, the demographic groups most similar to Paiute are Senegalese ($82,852, a difference of 0.16%), Immigrants from Belize ($83,141, a difference of 0.19%), Pima ($82,821, a difference of 0.20%), Immigrants from Jamaica ($83,298, a difference of 0.38%), and Colville ($82,604, a difference of 0.46%).
| Demographics | Rating | Rank | Householder Income Ages 25 - 44 years |
| Jamaicans | 0.3 /100 | #270 | Tragic $83,933 |
| Somalis | 0.2 /100 | #271 | Tragic $83,752 |
| Spanish Americans | 0.2 /100 | #272 | Tragic $83,722 |
| Iroquois | 0.2 /100 | #273 | Tragic $83,682 |
| Marshallese | 0.2 /100 | #274 | Tragic $83,575 |
| Immigrants | Jamaica | 0.2 /100 | #275 | Tragic $83,298 |
| Immigrants | Belize | 0.2 /100 | #276 | Tragic $83,141 |
| Paiute | 0.2 /100 | #277 | Tragic $82,984 |
| Senegalese | 0.2 /100 | #278 | Tragic $82,852 |
| Pima | 0.1 /100 | #279 | Tragic $82,821 |
| Colville | 0.1 /100 | #280 | Tragic $82,604 |
| Cajuns | 0.1 /100 | #281 | Tragic $82,393 |
| Central American Indians | 0.1 /100 | #282 | Tragic $82,355 |
| Guatemalans | 0.1 /100 | #283 | Tragic $82,331 |
| Immigrants | Middle Africa | 0.1 /100 | #284 | Tragic $82,254 |