Immigrants from Indonesia vs Immigrants from Eastern Europe Householder Income Ages 25 - 44 years

COMPARE

Immigrants from Indonesia
Race
Ancestry
AfghanAfricanAlaska NativeAlaskan AthabascanAlbanianAleutAlsatianAmericanApacheArabArapahoArgentineanArmenianAssyrian/Chaldean/SyriacAustralianAustrianBahamianBangladeshiBarbadianBasqueBelgianBelizeanBermudanBhutaneseBlackfeetBolivianBrazilianBritishBritish West IndianBulgarianBurmeseCajunCambodianCanadianCape VerdeanCarpatho RusynCelticCentral AmericanCentral American IndianCherokeeCheyenneChickasawChileanChineseChippewaChoctawColombianColvilleComancheCosta RicanCreeCreekCroatianCrowCubanCypriotCzechCzechoslovakianDanishDelawareDominicanDutchDutch West IndianEastern EuropeanEcuadorianEgyptianEnglishEstonianEthiopianEuropeanFijianFilipinoFinnishFrenchFrench American IndianFrench CanadianGermanGerman RussianGhanaianGreekGuamanian/ChamorroGuatemalanGuyaneseHaitianHmongHonduranHopiHoumaHungarianIcelanderIndian (Asian)IndonesianInupiatIranianIraqiIrishIroquoisIsraeliItalianJamaicanJapaneseJordanianKenyanKiowaKoreanLaotianLatvianLebaneseLiberianLithuanianLumbeeLuxembourgerMacedonianMalaysianMalteseMarshalleseMenomineeMexicanMexican American IndianMongolianMoroccanNative HawaiianNavajoNepaleseNew ZealanderNicaraguanNigerianNorthern EuropeanNorwegianOkinawanOsageOttawaPaiutePakistaniPalestinianPanamanianParaguayanPennsylvania GermanPeruvianPimaPolishPortuguesePotawatomiPuebloPuerto RicanPuget Sound SalishRomanianRussianSalvadoranSamoanScandinavianScotch-IrishScottishSeminoleSenegaleseSerbianShoshoneSierra LeoneanSiouxSlavicSlovakSloveneSomaliSouth AfricanSouth AmericanSouth American IndianSoviet UnionSpaniardSpanishSpanish AmericanSpanish American IndianSri LankanSubsaharan AfricanSudaneseSwedishSwissSyrianTaiwaneseThaiTlingit-HaidaTohono O'OdhamTonganTrinidadian and TobagonianTsimshianTurkishU.S. Virgin IslanderUgandanUkrainianUruguayanUteVenezuelanVietnameseWelshWest IndianYakamaYaquiYugoslavianYumanYup'ikZimbabwean
Immigration
NonimmigrantsImmigrantsAfghanistanAfricaAlbaniaArgentinaArmeniaAsiaAustraliaAustriaBahamasBangladeshBarbadosBelarusBelgiumBelizeBoliviaBosnia and HerzegovinaBrazilBulgariaBurma/MyanmarCabo VerdeCambodiaCameroonCanadaCaribbeanCentral AmericaChileChinaColombiaCongoCosta RicaCroatiaCubaCzechoslovakiaDenmarkDominicaDominican RepublicEastern AfricaEastern AsiaEcuadorEgyptEl SalvadorEnglandEritreaEthiopiaEuropeFijiFranceGermanyGhanaGreeceGrenadaGuatemalaGuyanaHaitiHondurasHong KongHungaryIndiaIndonesiaIranIraqIrelandIsraelItalyJamaicaJapanJordanKazakhstanKenyaKoreaKuwaitLaosLatin AmericaLatviaLebanonLiberiaLithuaniaMalaysiaMexicoMicronesiaMiddle AfricaMoldovaMoroccoNepalNetherlandsNicaraguaNigeriaNorth AmericaNorth MacedoniaNorthern AfricaNorthern EuropeNorwayOceaniaPakistanPanamaPeruPhilippinesPolandPortugalRomaniaRussiaSaudi ArabiaScotlandSenegalSerbiaSierra LeoneSingaporeSomaliaSouth AfricaSouth AmericaSouth Central AsiaSouth Eastern AsiaSouthern EuropeSpainSri LankaSt. Vincent and the GrenadinesSudanSwedenSwitzerlandSyriaTaiwanThailandTrinidad and TobagoTurkeyUgandaUkraineUruguayUzbekistanVenezuelaVietnamWest IndiesWestern AfricaWestern AsiaWestern EuropeYemenZaireZimbabweAzores
Immigrants from Eastern Europe
Race
Ancestry
AfghanAfricanAlaska NativeAlaskan AthabascanAlbanianAleutAlsatianAmericanApacheArabArapahoArgentineanArmenianAssyrian/Chaldean/SyriacAustralianAustrianBahamianBangladeshiBarbadianBasqueBelgianBelizeanBermudanBhutaneseBlackfeetBolivianBrazilianBritishBritish West IndianBulgarianBurmeseCajunCambodianCanadianCape VerdeanCarpatho RusynCelticCentral AmericanCentral American IndianCherokeeCheyenneChickasawChileanChineseChippewaChoctawColombianColvilleComancheCosta RicanCreeCreekCroatianCrowCubanCypriotCzechCzechoslovakianDanishDelawareDominicanDutchDutch West IndianEastern EuropeanEcuadorianEgyptianEnglishEstonianEthiopianEuropeanFijianFilipinoFinnishFrenchFrench American IndianFrench CanadianGermanGerman RussianGhanaianGreekGuamanian/ChamorroGuatemalanGuyaneseHaitianHmongHonduranHopiHoumaHungarianIcelanderIndian (Asian)IndonesianInupiatIranianIraqiIrishIroquoisIsraeliItalianJamaicanJapaneseJordanianKenyanKiowaKoreanLaotianLatvianLebaneseLiberianLithuanianLumbeeLuxembourgerMacedonianMalaysianMalteseMarshalleseMenomineeMexicanMexican American IndianMongolianMoroccanNative HawaiianNavajoNepaleseNew ZealanderNicaraguanNigerianNorthern EuropeanNorwegianOkinawanOsageOttawaPaiutePakistaniPalestinianPanamanianParaguayanPennsylvania GermanPeruvianPimaPolishPortuguesePotawatomiPuebloPuerto RicanPuget Sound SalishRomanianRussianSalvadoranSamoanScandinavianScotch-IrishScottishSeminoleSenegaleseSerbianShoshoneSierra LeoneanSiouxSlavicSlovakSloveneSomaliSouth AfricanSouth AmericanSouth American IndianSoviet UnionSpaniardSpanishSpanish AmericanSpanish American IndianSri LankanSubsaharan AfricanSudaneseSwedishSwissSyrianTaiwaneseThaiTlingit-HaidaTohono O'OdhamTonganTrinidadian and TobagonianTsimshianTurkishU.S. Virgin IslanderUgandanUkrainianUruguayanUteVenezuelanVietnameseWelshWest IndianYakamaYaquiYugoslavianYumanYup'ikZimbabwean
Immigration
NonimmigrantsImmigrantsAfghanistanAfricaAlbaniaArgentinaArmeniaAsiaAustraliaAustriaBahamasBangladeshBarbadosBelarusBelgiumBelizeBoliviaBosnia and HerzegovinaBrazilBulgariaBurma/MyanmarCabo VerdeCambodiaCameroonCanadaCaribbeanCentral AmericaChileChinaColombiaCongoCosta RicaCroatiaCubaCzechoslovakiaDenmarkDominicaDominican RepublicEastern AfricaEastern AsiaEastern EuropeEcuadorEgyptEl SalvadorEnglandEritreaEthiopiaEuropeFijiFranceGermanyGhanaGreeceGrenadaGuatemalaGuyanaHaitiHondurasHong KongHungaryIndiaIranIraqIrelandIsraelItalyJamaicaJapanJordanKazakhstanKenyaKoreaKuwaitLaosLatin AmericaLatviaLebanonLiberiaLithuaniaMalaysiaMexicoMicronesiaMiddle AfricaMoldovaMoroccoNepalNetherlandsNicaraguaNigeriaNorth AmericaNorth MacedoniaNorthern AfricaNorthern EuropeNorwayOceaniaPakistanPanamaPeruPhilippinesPolandPortugalRomaniaRussiaSaudi ArabiaScotlandSenegalSerbiaSierra LeoneSingaporeSomaliaSouth AfricaSouth AmericaSouth Central AsiaSouth Eastern AsiaSouthern EuropeSpainSri LankaSt. Vincent and the GrenadinesSudanSwedenSwitzerlandSyriaTaiwanThailandTrinidad and TobagoTurkeyUgandaUkraineUruguayUzbekistanVenezuelaVietnamWest IndiesWestern AfricaWestern AsiaWestern EuropeYemenZaireZimbabweAzores
Householder Income Ages 25 - 44 years
Income
Poverty
Unemployment
Labor Participation
Family Structure
Vehicle Availability
Education Level
Disability

Householder Income Ages 25 - 44 years Comparison

Immigrants from Indonesia

Immigrants from Eastern Europe

Exceptional
Exceptional
$107,627
HOUSEHOLDER INCOME AGES 25 - 44 YEARS
99.9/ 100
METRIC RATING
44th/ 347
METRIC RANK
$104,662
HOUSEHOLDER INCOME AGES 25 - 44 YEARS
99.6/ 100
METRIC RATING
68th/ 347
METRIC RANK

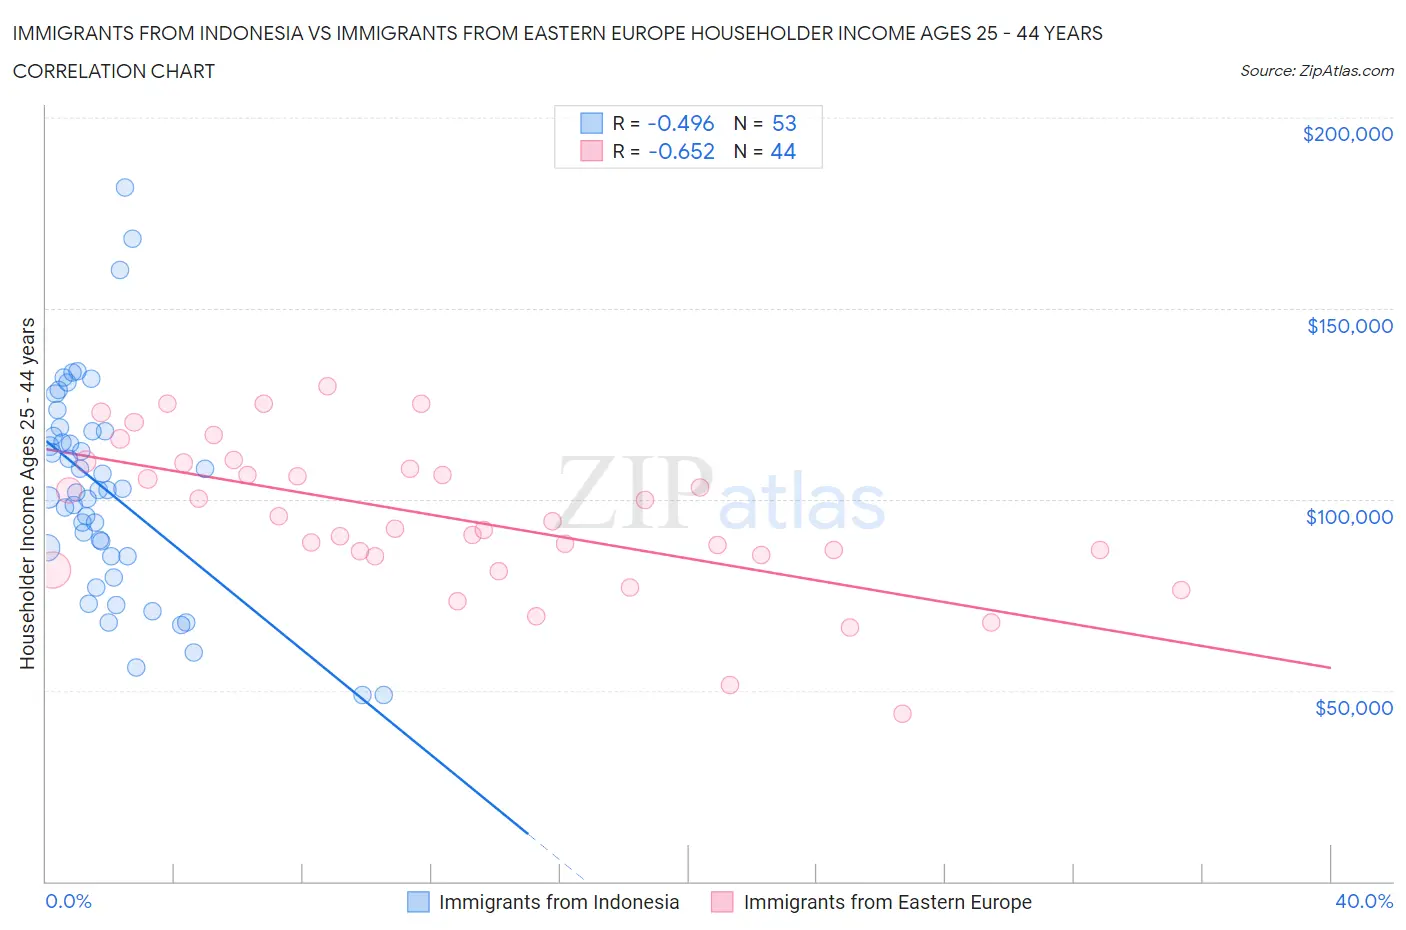
Immigrants from Indonesia vs Immigrants from Eastern Europe Householder Income Ages 25 - 44 years Correlation Chart

The statistical analysis conducted on geographies consisting of 215,479,216 people shows a moderate negative correlation between the proportion of Immigrants from Indonesia and household income with householder between the ages 25 and 44 in the United States with a correlation coefficient (R) of -0.496 and weighted average of $107,627. Similarly, the statistical analysis conducted on geographies consisting of 473,985,258 people shows a significant negative correlation between the proportion of Immigrants from Eastern Europe and household income with householder between the ages 25 and 44 in the United States with a correlation coefficient (R) of -0.652 and weighted average of $104,662, a difference of 2.8%.
Immigrants from Indonesia vs Immigrants from Eastern Europe Householder Income Ages 25 - 44 years

Householder Income Ages 25 - 44 years Correlation Summary

MeasurementImmigrants from IndonesiaImmigrants from Eastern Europe
Minimum$48,644$43,724
Maximum$181,667$129,765
Range$133,023$86,041
Mean$102,424$95,165
Median$102,321$93,230
Interquartile 25% (IQ1)$85,037$85,360
Interquartile 75% (IQ3)$117,969$108,718
Interquartile Range (IQR)$32,932$23,358
Standard Deviation (Sample)$28,015$19,648
Standard Deviation (Population)$27,749$19,424

Similar Demographics by Householder Income Ages 25 - 44 years

Demographics Similar to Immigrants from Indonesia by Householder Income Ages 25 - 44 years

In terms of householder income ages 25 - 44 years, the demographic groups most similar to Immigrants from Indonesia are Immigrants from Malaysia ($107,650, a difference of 0.020%), Israeli ($107,579, a difference of 0.040%), Immigrants from Belarus ($107,393, a difference of 0.22%), Australian ($107,912, a difference of 0.26%), and Estonian ($107,269, a difference of 0.33%).
DemographicsRating | RankHouseholder Income Ages 25 - 44 years
Immigrants | Russia
100.0
/100
|
#37
Exceptional
$108,751
Soviet Union
100.0
/100
|
#38
Exceptional
$108,457
Immigrants | France
99.9
/100
|
#39
Exceptional
$108,257
Immigrants | Lithuania
99.9
/100
|
#40
Exceptional
$108,149
Immigrants | Bolivia
99.9
/100
|
#41
Exceptional
$108,128
Australians
99.9
/100
|
#42
Exceptional
$107,912
Immigrants | Malaysia
99.9
/100
|
#43
Exceptional
$107,650
Immigrants | Indonesia
99.9
/100
|
#44
Exceptional
$107,627
Israelis
99.9
/100
|
#45
Exceptional
$107,579
Immigrants | Belarus
99.9
/100
|
#46
Exceptional
$107,393
Estonians
99.9
/100
|
#47
Exceptional
$107,269
Bulgarians
99.9
/100
|
#48
Exceptional
$107,264
Immigrants | Turkey
99.9
/100
|
#49
Exceptional
$107,258
Cambodians
99.9
/100
|
#50
Exceptional
$107,148
Immigrants | Czechoslovakia
99.9
/100
|
#51
Exceptional
$106,888

Demographics Similar to Immigrants from Eastern Europe by Householder Income Ages 25 - 44 years

In terms of householder income ages 25 - 44 years, the demographic groups most similar to Immigrants from Eastern Europe are Immigrants from Romania ($104,713, a difference of 0.050%), Mongolian ($104,578, a difference of 0.080%), Immigrants from Croatia ($104,503, a difference of 0.15%), Afghan ($104,410, a difference of 0.24%), and Laotian ($104,993, a difference of 0.32%).
DemographicsRating | RankHouseholder Income Ages 25 - 44 years
Lithuanians
99.7
/100
|
#61
Exceptional
$105,223
Immigrants | Italy
99.7
/100
|
#62
Exceptional
$105,201
Immigrants | Scotland
99.7
/100
|
#63
Exceptional
$105,089
New Zealanders
99.7
/100
|
#64
Exceptional
$105,085
Immigrants | Netherlands
99.7
/100
|
#65
Exceptional
$105,082
Laotians
99.7
/100
|
#66
Exceptional
$104,993
Immigrants | Romania
99.6
/100
|
#67
Exceptional
$104,713
Immigrants | Eastern Europe
99.6
/100
|
#68
Exceptional
$104,662
Mongolians
99.6
/100
|
#69
Exceptional
$104,578
Immigrants | Croatia
99.6
/100
|
#70
Exceptional
$104,503
Afghans
99.6
/100
|
#71
Exceptional
$104,410
Chinese
99.5
/100
|
#72
Exceptional
$104,264
Italians
99.5
/100
|
#73
Exceptional
$104,215
Immigrants | Fiji
99.5
/100
|
#74
Exceptional
$103,954
Koreans
99.4
/100
|
#75
Exceptional
$103,824