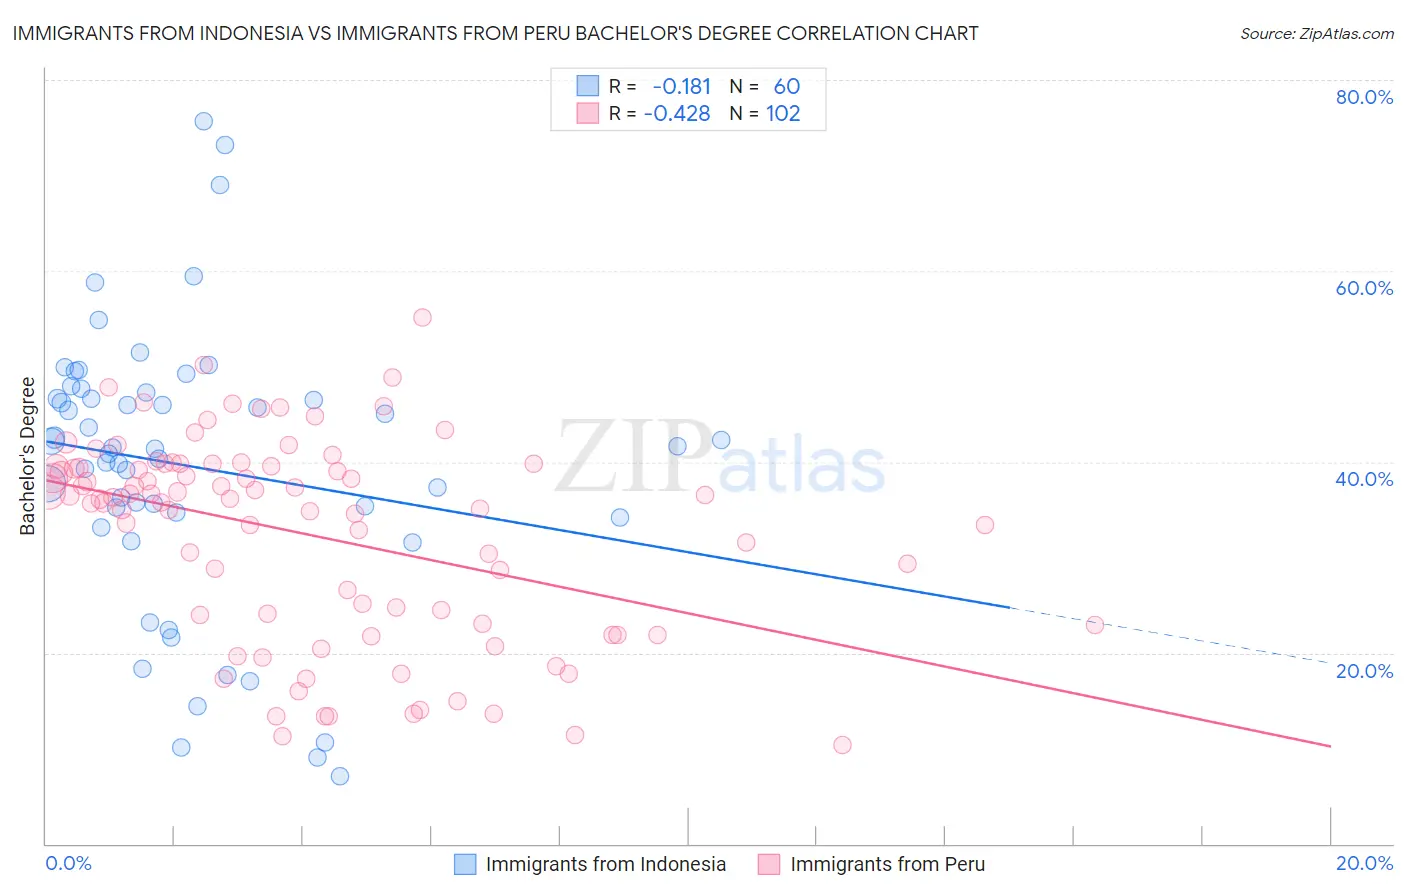
Immigrants from Indonesia vs Immigrants from Peru Bachelor's Degree
COMPARE
Immigrants from Indonesia
Immigrants from Peru
Bachelor's Degree
Bachelor's Degree Comparison
Immigrants from Indonesia
Immigrants from Peru
43.3%
BACHELOR'S DEGREE
99.7/ 100
METRIC RATING
68th/ 347
METRIC RANK
37.5%
BACHELOR'S DEGREE
41.3/ 100
METRIC RATING
185th/ 347
METRIC RANK
Immigrants from Indonesia vs Immigrants from Peru Bachelor's Degree Correlation Chart
The statistical analysis conducted on geographies consisting of 215,775,371 people shows a poor negative correlation between the proportion of Immigrants from Indonesia and percentage of population with at least bachelor's degree education in the United States with a correlation coefficient (R) of -0.181 and weighted average of 43.3%. Similarly, the statistical analysis conducted on geographies consisting of 328,855,740 people shows a moderate negative correlation between the proportion of Immigrants from Peru and percentage of population with at least bachelor's degree education in the United States with a correlation coefficient (R) of -0.428 and weighted average of 37.5%, a difference of 15.3%.
Bachelor's Degree Correlation Summary
| Measurement | Immigrants from Indonesia | Immigrants from Peru |
| Minimum | 7.0% | 10.3% |
| Maximum | 75.7% | 55.2% |
| Range | 68.7% | 44.9% |
| Mean | 39.5% | 32.4% |
| Median | 41.4% | 36.1% |
| Interquartile 25% (IQ1) | 34.4% | 23.0% |
| Interquartile 75% (IQ3) | 47.0% | 39.5% |
| Interquartile Range (IQR) | 12.6% | 16.5% |
| Standard Deviation (Sample) | 14.6% | 10.6% |
| Standard Deviation (Population) | 14.5% | 10.5% |
Similar Demographics by Bachelor's Degree
Demographics Similar to Immigrants from Indonesia by Bachelor's Degree
In terms of bachelor's degree, the demographic groups most similar to Immigrants from Indonesia are Egyptian (43.3%, a difference of 0.020%), Immigrants from Netherlands (43.3%, a difference of 0.040%), Zimbabwean (43.3%, a difference of 0.060%), Argentinean (43.3%, a difference of 0.070%), and Immigrants from Pakistan (43.1%, a difference of 0.26%).
| Demographics | Rating | Rank | Bachelor's Degree |
| South Africans | 99.8 /100 | #61 | Exceptional 43.6% |
| Immigrants | Kazakhstan | 99.8 /100 | #62 | Exceptional 43.4% |
| Immigrants | Europe | 99.8 /100 | #63 | Exceptional 43.4% |
| Argentineans | 99.7 /100 | #64 | Exceptional 43.3% |
| Zimbabweans | 99.7 /100 | #65 | Exceptional 43.3% |
| Immigrants | Netherlands | 99.7 /100 | #66 | Exceptional 43.3% |
| Egyptians | 99.7 /100 | #67 | Exceptional 43.3% |
| Immigrants | Indonesia | 99.7 /100 | #68 | Exceptional 43.3% |
| Immigrants | Pakistan | 99.7 /100 | #69 | Exceptional 43.1% |
| Immigrants | Romania | 99.6 /100 | #70 | Exceptional 42.9% |
| Immigrants | Argentina | 99.6 /100 | #71 | Exceptional 42.8% |
| Ethiopians | 99.5 /100 | #72 | Exceptional 42.8% |
| Immigrants | Uzbekistan | 99.5 /100 | #73 | Exceptional 42.8% |
| Bhutanese | 99.5 /100 | #74 | Exceptional 42.7% |
| Immigrants | Zimbabwe | 99.4 /100 | #75 | Exceptional 42.6% |
Demographics Similar to Immigrants from Peru by Bachelor's Degree
In terms of bachelor's degree, the demographic groups most similar to Immigrants from Peru are Scandinavian (37.5%, a difference of 0.040%), Senegalese (37.5%, a difference of 0.080%), Norwegian (37.5%, a difference of 0.10%), English (37.4%, a difference of 0.17%), and Immigrants from Bosnia and Herzegovina (37.6%, a difference of 0.21%).
| Demographics | Rating | Rank | Bachelor's Degree |
| Immigrants | Cameroon | 46.8 /100 | #178 | Average 37.7% |
| Immigrants | Colombia | 45.4 /100 | #179 | Average 37.7% |
| Irish | 44.3 /100 | #180 | Average 37.6% |
| Immigrants | Senegal | 43.8 /100 | #181 | Average 37.6% |
| Immigrants | Bosnia and Herzegovina | 43.4 /100 | #182 | Average 37.6% |
| Senegalese | 42.2 /100 | #183 | Average 37.5% |
| Scandinavians | 41.7 /100 | #184 | Average 37.5% |
| Immigrants | Peru | 41.3 /100 | #185 | Average 37.5% |
| Norwegians | 40.4 /100 | #186 | Average 37.5% |
| English | 39.7 /100 | #187 | Fair 37.4% |
| Immigrants | Oceania | 37.3 /100 | #188 | Fair 37.3% |
| Slovaks | 36.9 /100 | #189 | Fair 37.3% |
| Swiss | 34.1 /100 | #190 | Fair 37.2% |
| Nigerians | 33.9 /100 | #191 | Fair 37.2% |
| Immigrants | Vietnam | 32.1 /100 | #192 | Fair 37.1% |