Immigrants from Indonesia vs Basque Median Family Income
COMPARE
Immigrants from Indonesia
Basque
Median Family Income
Median Family Income Comparison
Immigrants from Indonesia
Basques
$115,162
MEDIAN FAMILY INCOME
99.8/ 100
METRIC RATING
58th/ 347
METRIC RANK
$104,760
MEDIAN FAMILY INCOME
74.4/ 100
METRIC RATING
156th/ 347
METRIC RANK
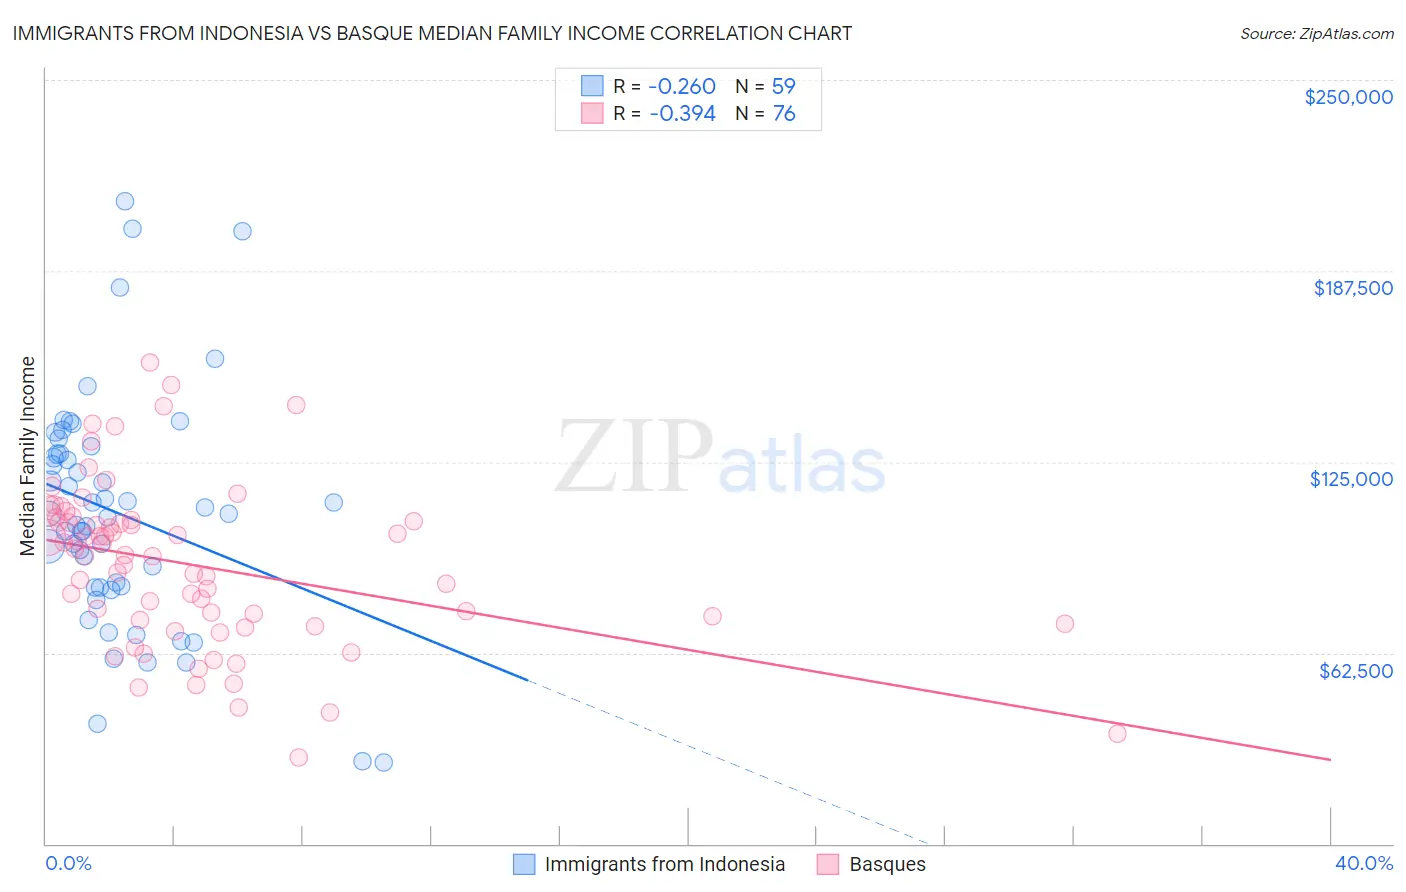
Immigrants from Indonesia vs Basque Median Family Income Correlation Chart
The statistical analysis conducted on geographies consisting of 215,683,063 people shows a weak negative correlation between the proportion of Immigrants from Indonesia and median family income in the United States with a correlation coefficient (R) of -0.260 and weighted average of $115,162. Similarly, the statistical analysis conducted on geographies consisting of 165,742,125 people shows a mild negative correlation between the proportion of Basques and median family income in the United States with a correlation coefficient (R) of -0.394 and weighted average of $104,760, a difference of 9.9%.
Median Family Income Correlation Summary
| Measurement | Immigrants from Indonesia | Basque |
| Minimum | $26,694 | $28,036 |
| Maximum | $210,375 | $157,351 |
| Range | $183,681 | $129,315 |
| Mean | $108,164 | $91,256 |
| Median | $108,113 | $94,457 |
| Interquartile 25% (IQ1) | $84,077 | $72,725 |
| Interquartile 75% (IQ3) | $127,666 | $105,919 |
| Interquartile Range (IQR) | $43,589 | $33,194 |
| Standard Deviation (Sample) | $37,920 | $26,783 |
| Standard Deviation (Population) | $37,598 | $26,606 |
Similar Demographics by Median Family Income
Demographics Similar to Immigrants from Indonesia by Median Family Income
In terms of median family income, the demographic groups most similar to Immigrants from Indonesia are Greek ($115,192, a difference of 0.030%), New Zealander ($115,230, a difference of 0.060%), Immigrants from Netherlands ($114,987, a difference of 0.15%), Lithuanian ($115,395, a difference of 0.20%), and Immigrants from Latvia ($114,826, a difference of 0.29%).
| Demographics | Rating | Rank | Median Family Income |
| Immigrants | Malaysia | 99.9 /100 | #51 | Exceptional $115,880 |
| Maltese | 99.9 /100 | #52 | Exceptional $115,862 |
| Immigrants | Norway | 99.9 /100 | #53 | Exceptional $115,847 |
| Immigrants | Europe | 99.9 /100 | #54 | Exceptional $115,523 |
| Lithuanians | 99.8 /100 | #55 | Exceptional $115,395 |
| New Zealanders | 99.8 /100 | #56 | Exceptional $115,230 |
| Greeks | 99.8 /100 | #57 | Exceptional $115,192 |
| Immigrants | Indonesia | 99.8 /100 | #58 | Exceptional $115,162 |
| Immigrants | Netherlands | 99.8 /100 | #59 | Exceptional $114,987 |
| Immigrants | Latvia | 99.8 /100 | #60 | Exceptional $114,826 |
| Immigrants | Belarus | 99.8 /100 | #61 | Exceptional $114,586 |
| Mongolians | 99.8 /100 | #62 | Exceptional $114,553 |
| Immigrants | Pakistan | 99.8 /100 | #63 | Exceptional $114,406 |
| Immigrants | Scotland | 99.7 /100 | #64 | Exceptional $114,392 |
| Egyptians | 99.7 /100 | #65 | Exceptional $114,119 |
Demographics Similar to Basques by Median Family Income
In terms of median family income, the demographic groups most similar to Basques are Native Hawaiian ($104,910, a difference of 0.14%), Immigrants from Nepal ($104,966, a difference of 0.20%), Moroccan ($104,488, a difference of 0.26%), Scandinavian ($104,410, a difference of 0.34%), and Swiss ($104,396, a difference of 0.35%).
| Demographics | Rating | Rank | Median Family Income |
| Immigrants | Germany | 80.9 /100 | #149 | Excellent $105,507 |
| Irish | 80.5 /100 | #150 | Excellent $105,453 |
| Peruvians | 80.4 /100 | #151 | Excellent $105,444 |
| Immigrants | Albania | 79.1 /100 | #152 | Good $105,285 |
| Slavs | 77.9 /100 | #153 | Good $105,144 |
| Immigrants | Nepal | 76.3 /100 | #154 | Good $104,966 |
| Native Hawaiians | 75.8 /100 | #155 | Good $104,910 |
| Basques | 74.4 /100 | #156 | Good $104,760 |
| Moroccans | 71.6 /100 | #157 | Good $104,488 |
| Scandinavians | 70.8 /100 | #158 | Good $104,410 |
| Swiss | 70.7 /100 | #159 | Good $104,396 |
| Scottish | 69.5 /100 | #160 | Good $104,288 |
| Icelanders | 69.4 /100 | #161 | Good $104,282 |
| Immigrants | Sierra Leone | 66.2 /100 | #162 | Good $103,990 |
| Costa Ricans | 66.2 /100 | #163 | Good $103,989 |