Immigrants from Honduras vs Immigrants from Morocco Householder Income Ages 25 - 44 years
COMPARE
Immigrants from Honduras
Immigrants from Morocco
Householder Income Ages 25 - 44 years
Householder Income Ages 25 - 44 years Comparison
Immigrants from Honduras
Immigrants from Morocco
$77,328
HOUSEHOLDER INCOME AGES 25 - 44 YEARS
0.0/ 100
METRIC RATING
323rd/ 347
METRIC RANK
$97,305
HOUSEHOLDER INCOME AGES 25 - 44 YEARS
82.0/ 100
METRIC RATING
140th/ 347
METRIC RANK
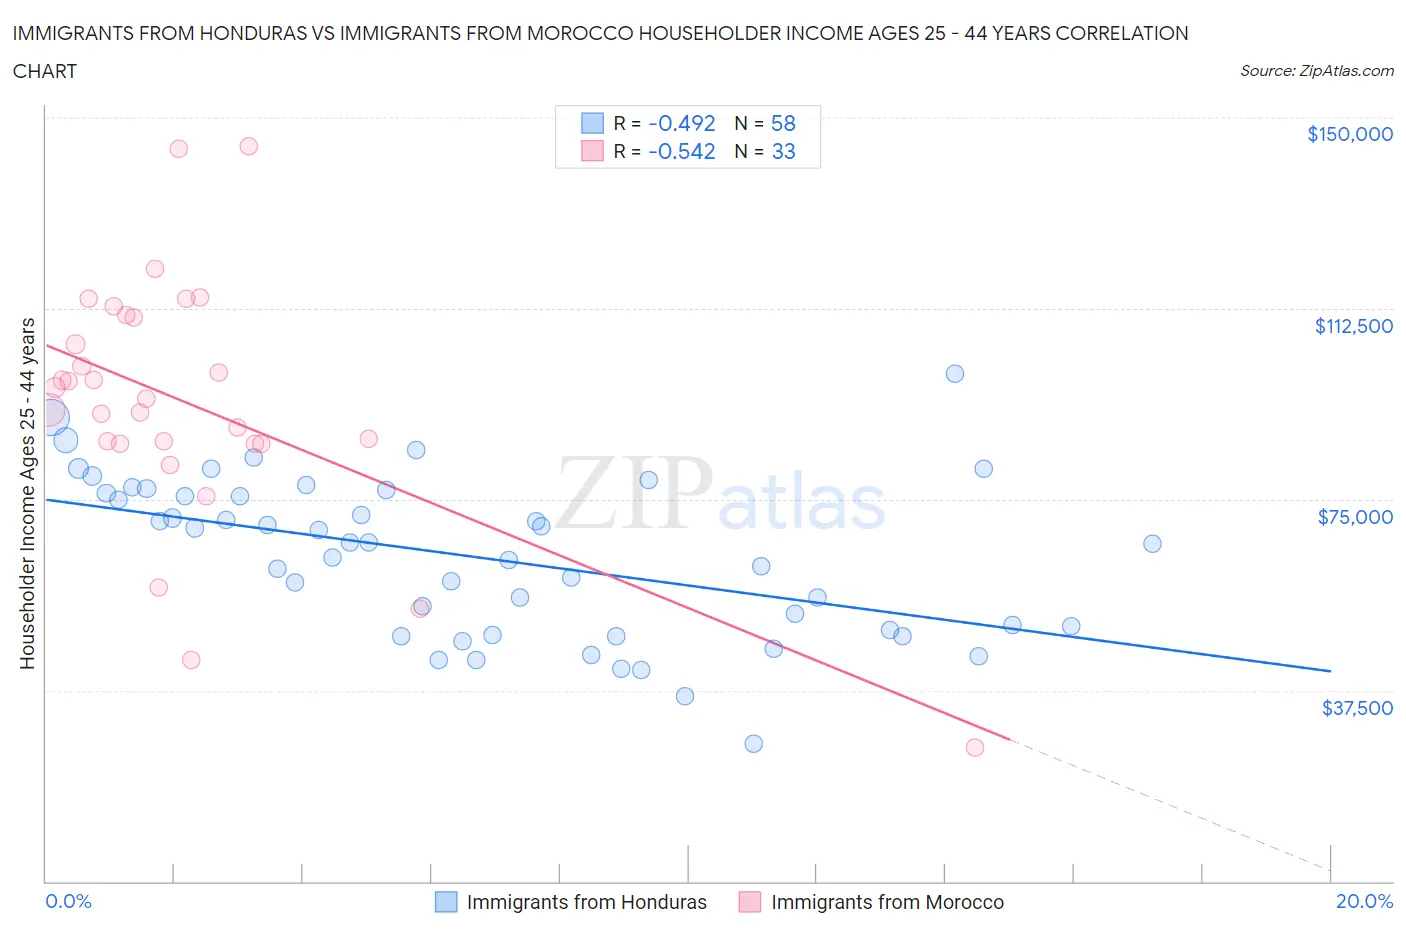
Immigrants from Honduras vs Immigrants from Morocco Householder Income Ages 25 - 44 years Correlation Chart
The statistical analysis conducted on geographies consisting of 321,952,844 people shows a moderate negative correlation between the proportion of Immigrants from Honduras and household income with householder between the ages 25 and 44 in the United States with a correlation coefficient (R) of -0.492 and weighted average of $77,328. Similarly, the statistical analysis conducted on geographies consisting of 178,797,729 people shows a substantial negative correlation between the proportion of Immigrants from Morocco and household income with householder between the ages 25 and 44 in the United States with a correlation coefficient (R) of -0.542 and weighted average of $97,305, a difference of 25.8%.
Householder Income Ages 25 - 44 years Correlation Summary
| Measurement | Immigrants from Honduras | Immigrants from Morocco |
| Minimum | $26,956 | $26,250 |
| Maximum | $99,657 | $144,345 |
| Range | $72,701 | $118,095 |
| Mean | $63,676 | $93,983 |
| Median | $66,366 | $94,739 |
| Interquartile 25% (IQ1) | $49,234 | $85,878 |
| Interquartile 75% (IQ3) | $76,183 | $111,008 |
| Interquartile Range (IQR) | $26,949 | $25,131 |
| Standard Deviation (Sample) | $15,519 | $24,483 |
| Standard Deviation (Population) | $15,385 | $24,109 |
Similar Demographics by Householder Income Ages 25 - 44 years
Demographics Similar to Immigrants from Honduras by Householder Income Ages 25 - 44 years
In terms of householder income ages 25 - 44 years, the demographic groups most similar to Immigrants from Honduras are Dutch West Indian ($77,260, a difference of 0.090%), Sioux ($77,089, a difference of 0.31%), Houma ($77,044, a difference of 0.37%), Immigrants from Bahamas ($76,910, a difference of 0.54%), and Chickasaw ($77,929, a difference of 0.78%).
| Demographics | Rating | Rank | Householder Income Ages 25 - 44 years |
| Africans | 0.0 /100 | #316 | Tragic $78,986 |
| U.S. Virgin Islanders | 0.0 /100 | #317 | Tragic $78,911 |
| Immigrants | Mexico | 0.0 /100 | #318 | Tragic $78,809 |
| Hondurans | 0.0 /100 | #319 | Tragic $78,540 |
| Choctaw | 0.0 /100 | #320 | Tragic $78,168 |
| Immigrants | Zaire | 0.0 /100 | #321 | Tragic $78,045 |
| Chickasaw | 0.0 /100 | #322 | Tragic $77,929 |
| Immigrants | Honduras | 0.0 /100 | #323 | Tragic $77,328 |
| Dutch West Indians | 0.0 /100 | #324 | Tragic $77,260 |
| Sioux | 0.0 /100 | #325 | Tragic $77,089 |
| Houma | 0.0 /100 | #326 | Tragic $77,044 |
| Immigrants | Bahamas | 0.0 /100 | #327 | Tragic $76,910 |
| Immigrants | Cuba | 0.0 /100 | #328 | Tragic $76,701 |
| Seminole | 0.0 /100 | #329 | Tragic $76,584 |
| Yakama | 0.0 /100 | #330 | Tragic $76,226 |
Demographics Similar to Immigrants from Morocco by Householder Income Ages 25 - 44 years
In terms of householder income ages 25 - 44 years, the demographic groups most similar to Immigrants from Morocco are Immigrants from Peru ($97,329, a difference of 0.020%), Lebanese ($97,339, a difference of 0.030%), Arab ($97,336, a difference of 0.030%), Luxembourger ($97,237, a difference of 0.070%), and Danish ($97,221, a difference of 0.090%).
| Demographics | Rating | Rank | Householder Income Ages 25 - 44 years |
| Tsimshian | 85.8 /100 | #133 | Excellent $97,809 |
| Canadians | 84.5 /100 | #134 | Excellent $97,625 |
| Immigrants | Oceania | 84.5 /100 | #135 | Excellent $97,623 |
| Hungarians | 83.9 /100 | #136 | Excellent $97,544 |
| Lebanese | 82.3 /100 | #137 | Excellent $97,339 |
| Arabs | 82.3 /100 | #138 | Excellent $97,336 |
| Immigrants | Peru | 82.2 /100 | #139 | Excellent $97,329 |
| Immigrants | Morocco | 82.0 /100 | #140 | Excellent $97,305 |
| Luxembourgers | 81.5 /100 | #141 | Excellent $97,237 |
| Danes | 81.3 /100 | #142 | Excellent $97,221 |
| Immigrants | Jordan | 81.0 /100 | #143 | Excellent $97,185 |
| Immigrants | Chile | 80.8 /100 | #144 | Excellent $97,159 |
| Norwegians | 78.2 /100 | #145 | Good $96,866 |
| Ethiopians | 77.8 /100 | #146 | Good $96,824 |
| Immigrants | Syria | 77.4 /100 | #147 | Good $96,789 |