Immigrants from Dominica vs U.S. Virgin Islander Householder Income Ages 45 - 64 years
COMPARE
Immigrants from Dominica
U.S. Virgin Islander
Householder Income Ages 45 - 64 years
Householder Income Ages 45 - 64 years Comparison
Immigrants from Dominica
U.S. Virgin Islanders
$83,311
HOUSEHOLDER INCOME AGES 45 - 64 YEARS
0.0/ 100
METRIC RATING
309th/ 347
METRIC RANK
$82,736
HOUSEHOLDER INCOME AGES 45 - 64 YEARS
0.0/ 100
METRIC RATING
313th/ 347
METRIC RANK
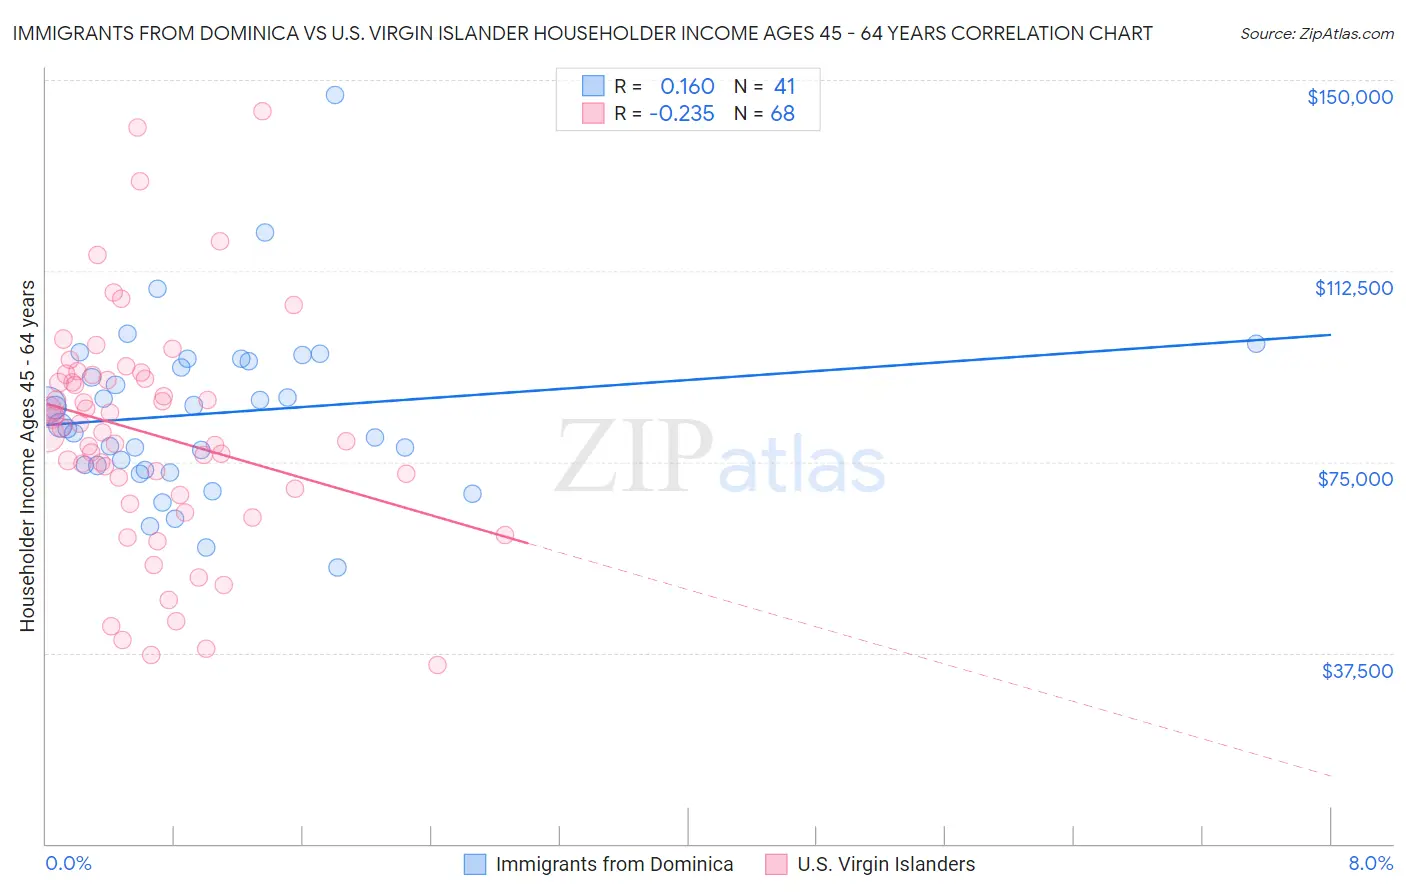
Immigrants from Dominica vs U.S. Virgin Islander Householder Income Ages 45 - 64 years Correlation Chart
The statistical analysis conducted on geographies consisting of 83,752,820 people shows a poor positive correlation between the proportion of Immigrants from Dominica and household income with householder between the ages 45 and 64 in the United States with a correlation coefficient (R) of 0.160 and weighted average of $83,311. Similarly, the statistical analysis conducted on geographies consisting of 87,479,620 people shows a weak negative correlation between the proportion of U.S. Virgin Islanders and household income with householder between the ages 45 and 64 in the United States with a correlation coefficient (R) of -0.235 and weighted average of $82,736, a difference of 0.70%.
Householder Income Ages 45 - 64 years Correlation Summary
| Measurement | Immigrants from Dominica | U.S. Virgin Islander |
| Minimum | $54,250 | $35,018 |
| Maximum | $147,083 | $143,798 |
| Range | $92,833 | $108,780 |
| Mean | $84,539 | $80,559 |
| Median | $82,174 | $81,314 |
| Interquartile 25% (IQ1) | $73,845 | $69,189 |
| Interquartile 75% (IQ3) | $95,001 | $91,656 |
| Interquartile Range (IQR) | $21,156 | $22,467 |
| Standard Deviation (Sample) | $16,874 | $22,451 |
| Standard Deviation (Population) | $16,667 | $22,285 |
Demographics Similar to Immigrants from Dominica and U.S. Virgin Islanders by Householder Income Ages 45 - 64 years
In terms of householder income ages 45 - 64 years, the demographic groups most similar to Immigrants from Dominica are Immigrants from Haiti ($83,257, a difference of 0.060%), Immigrants from Bahamas ($83,177, a difference of 0.16%), Immigrants from Cabo Verde ($83,542, a difference of 0.28%), Shoshone ($83,588, a difference of 0.33%), and Cajun ($83,015, a difference of 0.36%). Similarly, the demographic groups most similar to U.S. Virgin Islanders are Immigrants from Honduras ($82,697, a difference of 0.050%), Paiute ($82,629, a difference of 0.13%), Immigrants from Caribbean ($82,513, a difference of 0.27%), Colville ($82,474, a difference of 0.32%), and Cajun ($83,015, a difference of 0.34%).
| Demographics | Rating | Rank | Householder Income Ages 45 - 64 years |
| Potawatomi | 0.0 /100 | #301 | Tragic $84,613 |
| Haitians | 0.0 /100 | #302 | Tragic $84,384 |
| Hondurans | 0.0 /100 | #303 | Tragic $84,079 |
| Ottawa | 0.0 /100 | #304 | Tragic $83,953 |
| Chippewa | 0.0 /100 | #305 | Tragic $83,943 |
| Ute | 0.0 /100 | #306 | Tragic $83,937 |
| Shoshone | 0.0 /100 | #307 | Tragic $83,588 |
| Immigrants | Cabo Verde | 0.0 /100 | #308 | Tragic $83,542 |
| Immigrants | Dominica | 0.0 /100 | #309 | Tragic $83,311 |
| Immigrants | Haiti | 0.0 /100 | #310 | Tragic $83,257 |
| Immigrants | Bahamas | 0.0 /100 | #311 | Tragic $83,177 |
| Cajuns | 0.0 /100 | #312 | Tragic $83,015 |
| U.S. Virgin Islanders | 0.0 /100 | #313 | Tragic $82,736 |
| Immigrants | Honduras | 0.0 /100 | #314 | Tragic $82,697 |
| Paiute | 0.0 /100 | #315 | Tragic $82,629 |
| Immigrants | Caribbean | 0.0 /100 | #316 | Tragic $82,513 |
| Colville | 0.0 /100 | #317 | Tragic $82,474 |
| Choctaw | 0.0 /100 | #318 | Tragic $82,287 |
| Chickasaw | 0.0 /100 | #319 | Tragic $82,193 |
| Apache | 0.0 /100 | #320 | Tragic $82,184 |
| Yuman | 0.0 /100 | #321 | Tragic $82,139 |