Immigrants from Guyana vs Immigrants from Philippines Householder Income Over 65 years
COMPARE
Immigrants from Guyana
Immigrants from Philippines
Householder Income Over 65 years
Householder Income Over 65 years Comparison
Immigrants from Guyana
Immigrants from Philippines
$56,495
HOUSEHOLDER INCOME OVER 65 YEARS
0.9/ 100
METRIC RATING
241st/ 347
METRIC RANK
$66,161
HOUSEHOLDER INCOME OVER 65 YEARS
99.6/ 100
METRIC RATING
58th/ 347
METRIC RANK
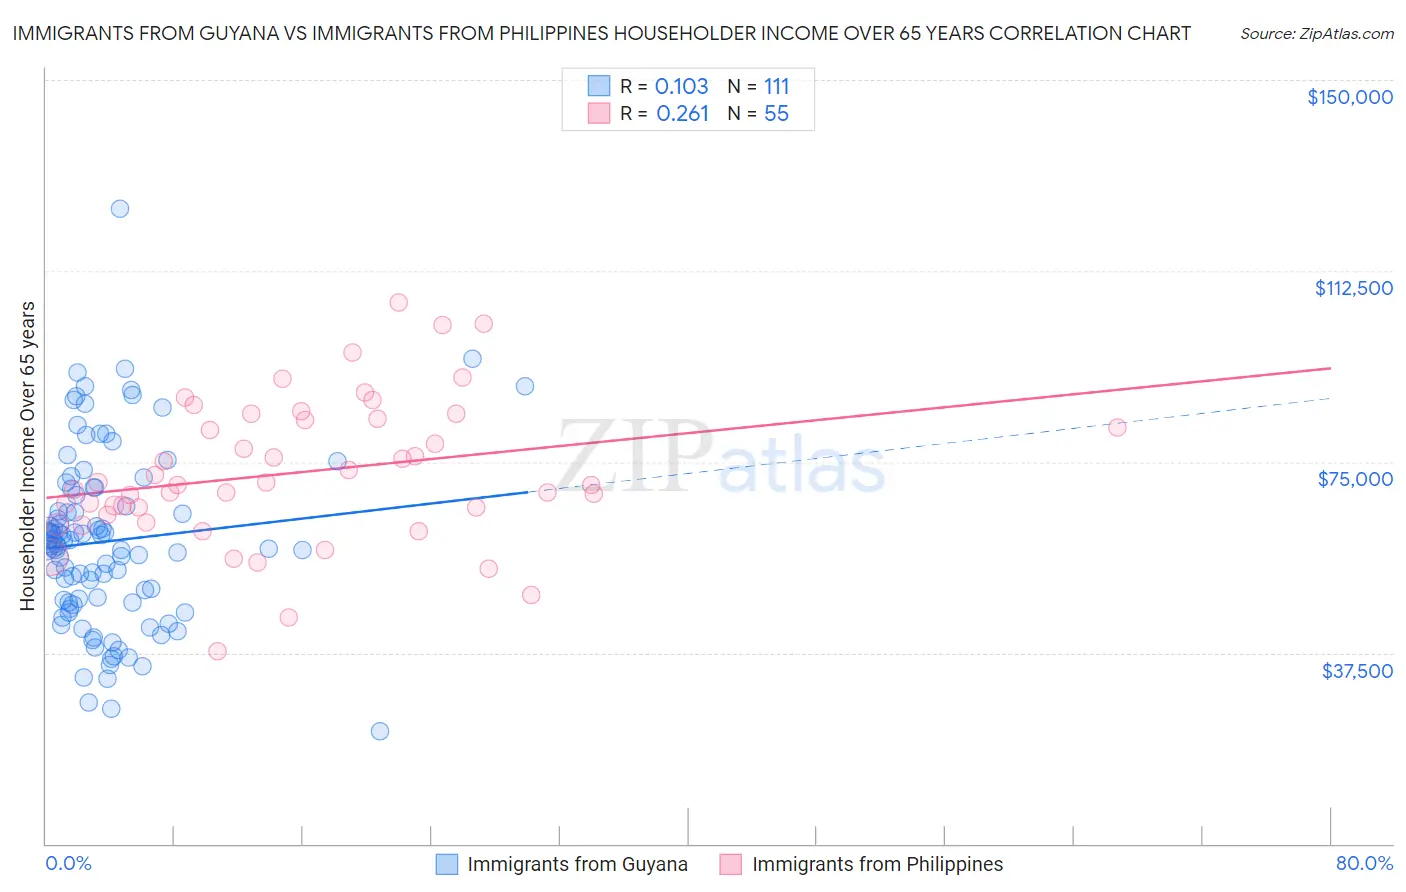
Immigrants from Guyana vs Immigrants from Philippines Householder Income Over 65 years Correlation Chart
The statistical analysis conducted on geographies consisting of 183,323,030 people shows a poor positive correlation between the proportion of Immigrants from Guyana and household income with householder over the age of 65 in the United States with a correlation coefficient (R) of 0.103 and weighted average of $56,495. Similarly, the statistical analysis conducted on geographies consisting of 469,098,262 people shows a weak positive correlation between the proportion of Immigrants from Philippines and household income with householder over the age of 65 in the United States with a correlation coefficient (R) of 0.261 and weighted average of $66,161, a difference of 17.1%.
Householder Income Over 65 years Correlation Summary
| Measurement | Immigrants from Guyana | Immigrants from Philippines |
| Minimum | $22,090 | $37,713 |
| Maximum | $124,816 | $106,262 |
| Range | $102,726 | $68,549 |
| Mean | $59,437 | $72,886 |
| Median | $58,833 | $70,497 |
| Interquartile 25% (IQ1) | $47,500 | $64,489 |
| Interquartile 75% (IQ3) | $68,572 | $83,466 |
| Interquartile Range (IQR) | $21,072 | $18,977 |
| Standard Deviation (Sample) | $17,169 | $14,178 |
| Standard Deviation (Population) | $17,091 | $14,049 |
Similar Demographics by Householder Income Over 65 years
Demographics Similar to Immigrants from Guyana by Householder Income Over 65 years
In terms of householder income over 65 years, the demographic groups most similar to Immigrants from Guyana are Yaqui ($56,417, a difference of 0.14%), Subsaharan African ($56,615, a difference of 0.21%), Guyanese ($56,351, a difference of 0.26%), Hmong ($56,339, a difference of 0.28%), and Immigrants from Uzbekistan ($56,331, a difference of 0.29%).
| Demographics | Rating | Rank | Householder Income Over 65 years |
| Immigrants | Burma/Myanmar | 1.7 /100 | #234 | Tragic $57,114 |
| Spanish Americans | 1.6 /100 | #235 | Tragic $57,021 |
| Immigrants | Uruguay | 1.5 /100 | #236 | Tragic $56,975 |
| Immigrants | Panama | 1.5 /100 | #237 | Tragic $56,944 |
| Fijians | 1.2 /100 | #238 | Tragic $56,768 |
| Immigrants | Laos | 1.2 /100 | #239 | Tragic $56,722 |
| Sub-Saharan Africans | 1.0 /100 | #240 | Tragic $56,615 |
| Immigrants | Guyana | 0.9 /100 | #241 | Tragic $56,495 |
| Yaqui | 0.8 /100 | #242 | Tragic $56,417 |
| Guyanese | 0.8 /100 | #243 | Tragic $56,351 |
| Hmong | 0.8 /100 | #244 | Tragic $56,339 |
| Immigrants | Uzbekistan | 0.8 /100 | #245 | Tragic $56,331 |
| Central Americans | 0.8 /100 | #246 | Tragic $56,321 |
| Yakama | 0.7 /100 | #247 | Tragic $56,234 |
| Vietnamese | 0.6 /100 | #248 | Tragic $56,143 |
Demographics Similar to Immigrants from Philippines by Householder Income Over 65 years
In terms of householder income over 65 years, the demographic groups most similar to Immigrants from Philippines are Immigrants from Norway ($66,118, a difference of 0.060%), Bulgarian ($66,236, a difference of 0.11%), Immigrants from Lithuania ($66,087, a difference of 0.11%), Maltese ($66,027, a difference of 0.20%), and Laotian ($66,306, a difference of 0.22%).
| Demographics | Rating | Rank | Householder Income Over 65 years |
| Israelis | 99.7 /100 | #51 | Exceptional $66,636 |
| Immigrants | Scotland | 99.7 /100 | #52 | Exceptional $66,620 |
| Immigrants | Pakistan | 99.7 /100 | #53 | Exceptional $66,617 |
| Immigrants | Netherlands | 99.7 /100 | #54 | Exceptional $66,463 |
| Immigrants | Czechoslovakia | 99.7 /100 | #55 | Exceptional $66,376 |
| Laotians | 99.6 /100 | #56 | Exceptional $66,306 |
| Bulgarians | 99.6 /100 | #57 | Exceptional $66,236 |
| Immigrants | Philippines | 99.6 /100 | #58 | Exceptional $66,161 |
| Immigrants | Norway | 99.5 /100 | #59 | Exceptional $66,118 |
| Immigrants | Lithuania | 99.5 /100 | #60 | Exceptional $66,087 |
| Maltese | 99.5 /100 | #61 | Exceptional $66,027 |
| Immigrants | Sierra Leone | 99.5 /100 | #62 | Exceptional $66,009 |
| Marshallese | 99.4 /100 | #63 | Exceptional $65,874 |
| Zimbabweans | 99.4 /100 | #64 | Exceptional $65,854 |
| Immigrants | England | 99.3 /100 | #65 | Exceptional $65,715 |