Pennsylvania German vs Brazilian Householder Income Ages 45 - 64 years
COMPARE
Pennsylvania German
Brazilian
Householder Income Ages 45 - 64 years
Householder Income Ages 45 - 64 years Comparison
Pennsylvania Germans
Brazilians
$91,956
HOUSEHOLDER INCOME AGES 45 - 64 YEARS
1.5/ 100
METRIC RATING
238th/ 347
METRIC RANK
$104,408
HOUSEHOLDER INCOME AGES 45 - 64 YEARS
88.6/ 100
METRIC RATING
135th/ 347
METRIC RANK
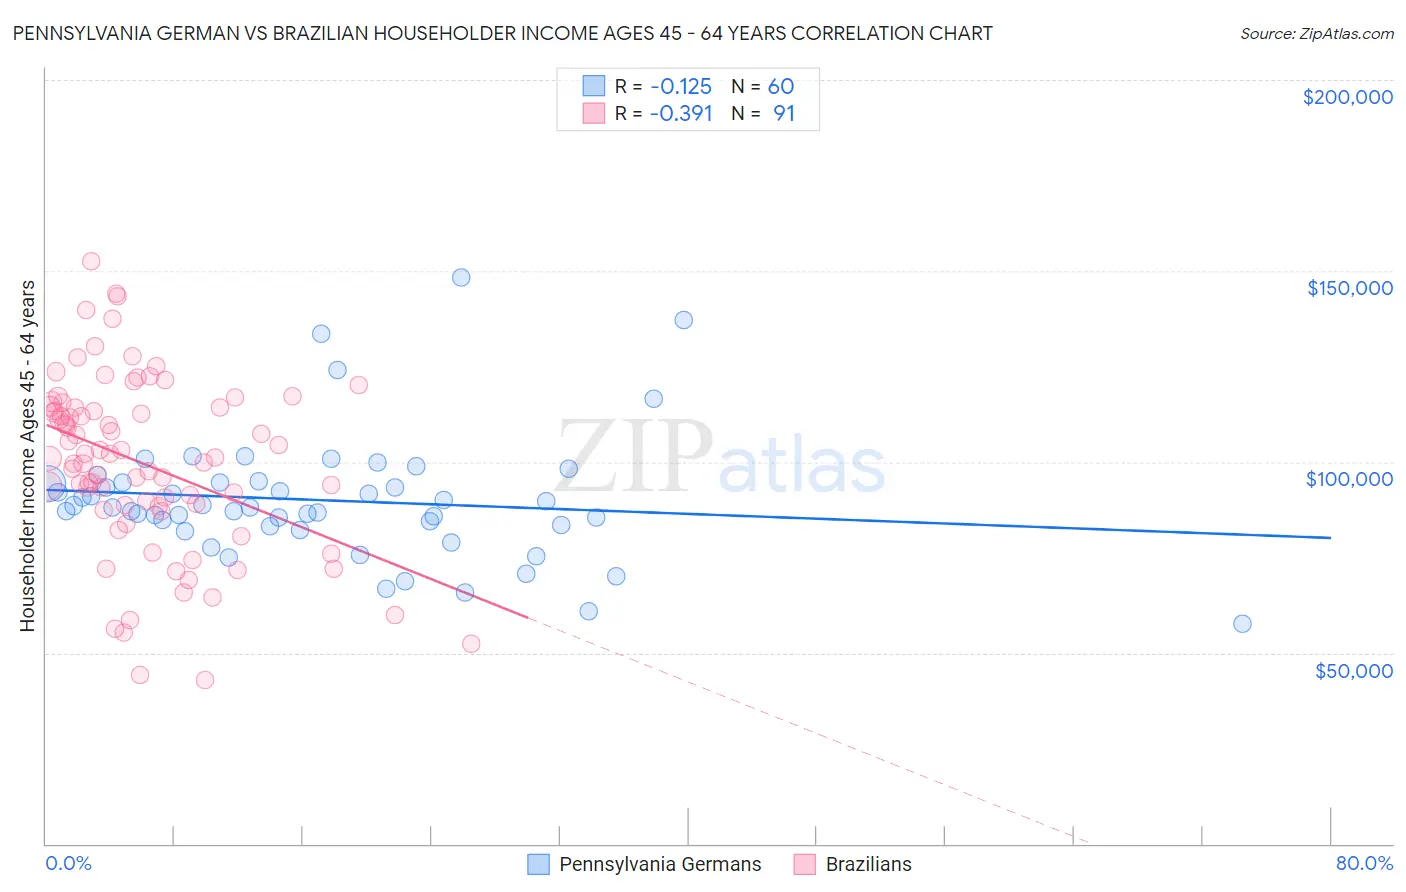
Pennsylvania German vs Brazilian Householder Income Ages 45 - 64 years Correlation Chart
The statistical analysis conducted on geographies consisting of 233,806,042 people shows a poor negative correlation between the proportion of Pennsylvania Germans and household income with householder between the ages 45 and 64 in the United States with a correlation coefficient (R) of -0.125 and weighted average of $91,956. Similarly, the statistical analysis conducted on geographies consisting of 323,438,021 people shows a mild negative correlation between the proportion of Brazilians and household income with householder between the ages 45 and 64 in the United States with a correlation coefficient (R) of -0.391 and weighted average of $104,408, a difference of 13.5%.
Householder Income Ages 45 - 64 years Correlation Summary
| Measurement | Pennsylvania German | Brazilian |
| Minimum | $57,750 | $42,860 |
| Maximum | $148,333 | $152,670 |
| Range | $90,583 | $109,810 |
| Mean | $89,968 | $99,594 |
| Median | $88,175 | $101,250 |
| Interquartile 25% (IQ1) | $83,450 | $88,262 |
| Interquartile 75% (IQ3) | $94,494 | $114,328 |
| Interquartile Range (IQR) | $11,044 | $26,066 |
| Standard Deviation (Sample) | $16,415 | $22,722 |
| Standard Deviation (Population) | $16,277 | $22,597 |
Similar Demographics by Householder Income Ages 45 - 64 years
Demographics Similar to Pennsylvania Germans by Householder Income Ages 45 - 64 years
In terms of householder income ages 45 - 64 years, the demographic groups most similar to Pennsylvania Germans are Immigrants from Bangladesh ($92,208, a difference of 0.27%), Immigrants from Western Africa ($92,384, a difference of 0.46%), Immigrants from Ecuador ($91,462, a difference of 0.54%), Immigrants from Burma/Myanmar ($91,385, a difference of 0.63%), and Nicaraguan ($92,554, a difference of 0.65%).
| Demographics | Rating | Rank | Householder Income Ages 45 - 64 years |
| Ecuadorians | 3.6 /100 | #231 | Tragic $93,739 |
| Sudanese | 3.5 /100 | #232 | Tragic $93,718 |
| Nepalese | 3.0 /100 | #233 | Tragic $93,355 |
| Immigrants | El Salvador | 2.7 /100 | #234 | Tragic $93,176 |
| Nicaraguans | 2.0 /100 | #235 | Tragic $92,554 |
| Immigrants | Western Africa | 1.8 /100 | #236 | Tragic $92,384 |
| Immigrants | Bangladesh | 1.7 /100 | #237 | Tragic $92,208 |
| Pennsylvania Germans | 1.5 /100 | #238 | Tragic $91,956 |
| Immigrants | Ecuador | 1.2 /100 | #239 | Tragic $91,462 |
| Immigrants | Burma/Myanmar | 1.1 /100 | #240 | Tragic $91,385 |
| Trinidadians and Tobagonians | 1.1 /100 | #241 | Tragic $91,357 |
| Inupiat | 1.1 /100 | #242 | Tragic $91,355 |
| Immigrants | Trinidad and Tobago | 1.1 /100 | #243 | Tragic $91,347 |
| Immigrants | Middle Africa | 1.1 /100 | #244 | Tragic $91,293 |
| Guyanese | 0.9 /100 | #245 | Tragic $90,966 |
Demographics Similar to Brazilians by Householder Income Ages 45 - 64 years
In terms of householder income ages 45 - 64 years, the demographic groups most similar to Brazilians are Arab ($104,566, a difference of 0.15%), Canadian ($104,560, a difference of 0.15%), Taiwanese ($104,180, a difference of 0.22%), Lebanese ($104,734, a difference of 0.31%), and Immigrants from Syria ($104,858, a difference of 0.43%).
| Demographics | Rating | Rank | Householder Income Ages 45 - 64 years |
| Native Hawaiians | 91.8 /100 | #128 | Exceptional $105,149 |
| Peruvians | 91.5 /100 | #129 | Exceptional $105,070 |
| Immigrants | Zimbabwe | 91.2 /100 | #130 | Exceptional $104,992 |
| Immigrants | Syria | 90.7 /100 | #131 | Exceptional $104,858 |
| Lebanese | 90.1 /100 | #132 | Exceptional $104,734 |
| Arabs | 89.3 /100 | #133 | Excellent $104,566 |
| Canadians | 89.3 /100 | #134 | Excellent $104,560 |
| Brazilians | 88.6 /100 | #135 | Excellent $104,408 |
| Taiwanese | 87.4 /100 | #136 | Excellent $104,180 |
| Hungarians | 85.8 /100 | #137 | Excellent $103,913 |
| Ethiopians | 84.7 /100 | #138 | Excellent $103,736 |
| Immigrants | Oceania | 84.5 /100 | #139 | Excellent $103,705 |
| Norwegians | 84.3 /100 | #140 | Excellent $103,682 |
| Immigrants | Uganda | 83.7 /100 | #141 | Excellent $103,584 |
| Luxembourgers | 83.3 /100 | #142 | Excellent $103,536 |